

AOGCM simulations. This method takes into account
two reliability criteria: the performance of the model in
reproducing present-day climate and the convergence
of the simulated changes across models. The REA
average was estimated as the weighted average of the
AOGCM ensemble members. The uncertainty range
was measured as the root-mean-square difference
around the REA average. In the REA method, a model
projection is reliable when both its present-day bias
and distance from the ensemble average are within the
natural variability. When compared to simpler
approaches, the REA method estimated a reduction of
the uncertainty range in the simulated seasonal temperature and precipitation changes over land regions of
subcontinental scale (Giorgi and Mearns 2002).
The REA method reduces the uncertainty range by
minimizing the contribution of simulations that either
performed poorly in the representation of present-day
climate over a region or provided outlier simulations
with respect to the other models in the ensemble, thus
extracting only the most reliable information from
each model (Giorgi and Mearns 2002). The use of
REA methodology reduced the overall CMIP5 model
uncertainty range compared to simpler ensemble
average approach for the future projections of surface
air temperature and precipitation during the Indian
summer monsoon season (Sengupta and Rajeevan
2013). The estimated REA average projected mean
monsoon warming was also characterized by consistently high-reliability index in comparison with participating individual CMIP5 AOGCMs.
The results of applying this REA methodology to
the dynamically downscaled CORDEX South Asia
multi-RCMs and the statistically downscaled
NEX-GDDP all India averaged annual surface air
temperature changes under the three different RCP
scenarios are assessed in Sect. 2.3.1. A measure of
natural variability is estimated following Sengupta and
Rajeevan (2013) as the difference between the maximum and minimum values of the 30 years moving
average of the time series of all India averaged surface
air temperature data available from the Indian Institute
of Tropical Meteorology (IITM, Pune, http://www.
tropmet.res.in) for the period 1901–2005, after linearly
detrending the data (to remove century-scale trends).
The natural variability in the observed all India
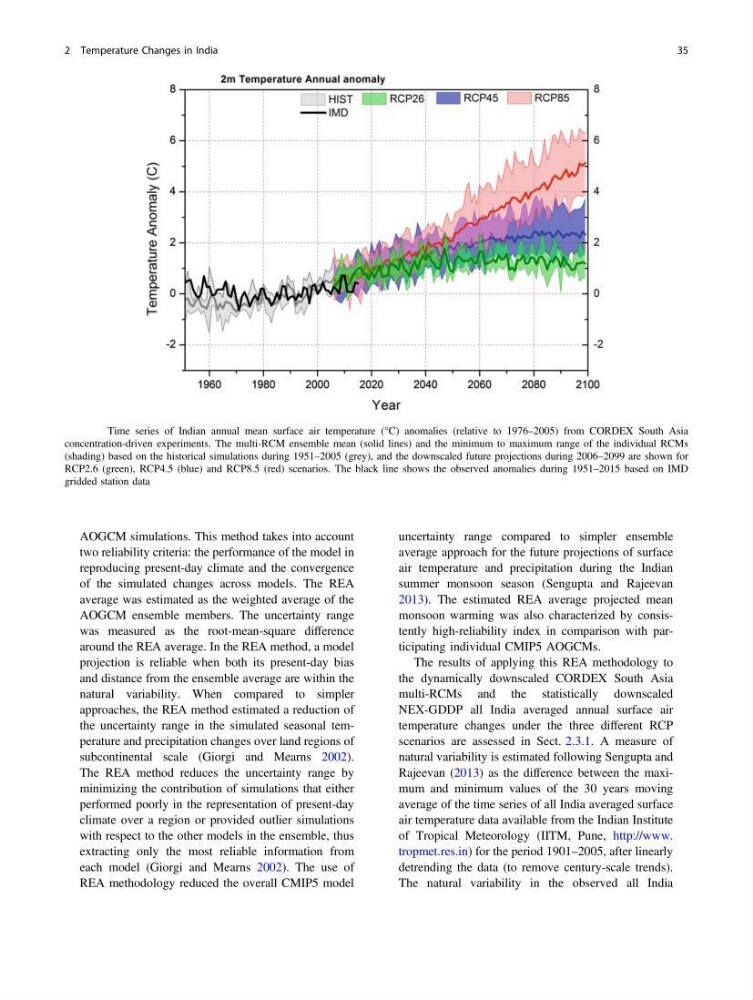
Fig. 2.8 Time series of Indian annual mean surface air temperature (°C) anomalies (relative to 1976–2005) from CORDEX South Asia
concentration-driven experiments. The multi-RCM ensemble mean (solid lines) and the minimum to maximum range of the individual RCMs
(shading) based on the historical simulations during 1951–2005 (grey), and the downscaled future projections during 2006–2099 are shown for
RCP2.6 (green), RCP4.5 (blue) and RCP8.5 (red) scenarios. The black line shows the observed anomalies during 1951–2015 based on IMD
gridded station data
2 Temperature Changes in India
35
two reliability criteria: the performance of the model in
reproducing present-day climate and the convergence
of the simulated changes across models. The REA
average was estimated as the weighted average of the
AOGCM ensemble members. The uncertainty range
was measured as the root-mean-square difference
around the REA average. In the REA method, a model
projection is reliable when both its present-day bias
and distance from the ensemble average are within the
natural variability. When compared to simpler
approaches, the REA method estimated a reduction of
the uncertainty range in the simulated seasonal temperature and precipitation changes over land regions of
subcontinental scale (Giorgi and Mearns 2002).
The REA method reduces the uncertainty range by
minimizing the contribution of simulations that either
performed poorly in the representation of present-day
climate over a region or provided outlier simulations
with respect to the other models in the ensemble, thus
extracting only the most reliable information from
each model (Giorgi and Mearns 2002). The use of
REA methodology reduced the overall CMIP5 model
uncertainty range compared to simpler ensemble
average approach for the future projections of surface
air temperature and precipitation during the Indian
summer monsoon season (Sengupta and Rajeevan
2013). The estimated REA average projected mean
monsoon warming was also characterized by consistently high-reliability index in comparison with participating individual CMIP5 AOGCMs.
The results of applying this REA methodology to
the dynamically downscaled CORDEX South Asia
multi-RCMs and the statistically downscaled
NEX-GDDP all India averaged annual surface air
temperature changes under the three different RCP
scenarios are assessed in Sect. 2.3.1. A measure of
natural variability is estimated following Sengupta and
Rajeevan (2013) as the difference between the maximum and minimum values of the 30 years moving
average of the time series of all India averaged surface
air temperature data available from the Indian Institute
of Tropical Meteorology (IITM, Pune, http://www.
tropmet.res.in) for the period 1901–2005, after linearly
detrending the data (to remove century-scale trends).
The natural variability in the observed all India
Fig. 2.8 Time series of Indian annual mean surface air temperature (°C) anomalies (relative to 1976–2005) from CORDEX South Asia
concentration-driven experiments. The multi-RCM ensemble mean (solid lines) and the minimum to maximum range of the individual RCMs
(shading) based on the historical simulations during 1951–2005 (grey), and the downscaled future projections during 2006–2099 are shown for
RCP2.6 (green), RCP4.5 (blue) and RCP8.5 (red) scenarios. The black line shows the observed anomalies during 1951–2015 based on IMD
gridded station data
2 Temperature Changes in India
35