

These long-term changes in surface air temperature over
India during the twentieth century also broadly agree with
earlier assessments (e.g. Rupa Kumar et al. 1994; Sen Roy and
Balling 2005; Kothawale and Rupa Kumar 2005; Srivastava
et al. 2009; Kothawale et al. 2010a; Jain and Kumar 2012; Rai
et al. 2012; Vinnarasi et al. 2017; Kothawale et al. 2016;
Kulkarni et al. 2017; Srivastava et al. 2017, 2019). Indian
annual mean land surface air temperatures have warmed by
0.6 °C century
−1 between 1901 and 2018 (Srivastava et al.
2019). All India mean annual tropospheric temperature measured by radiosonde stations also showed an increasing trend
from the surface to 500 hPa during the period 1971–2015
(Kothawale and Singh 2017). A similar warming trend is
revealed by dendroclimatic studies over the eastern Himalaya
including Sikkim and Bhutan in recent decades (Krusic et al.
2015; Yadava et al. 2015; Borgaonkar et al. 2018). Further
details on the long-term changes of temperature over India
based on paleoclimatic proxies are provided in Box 2.1.
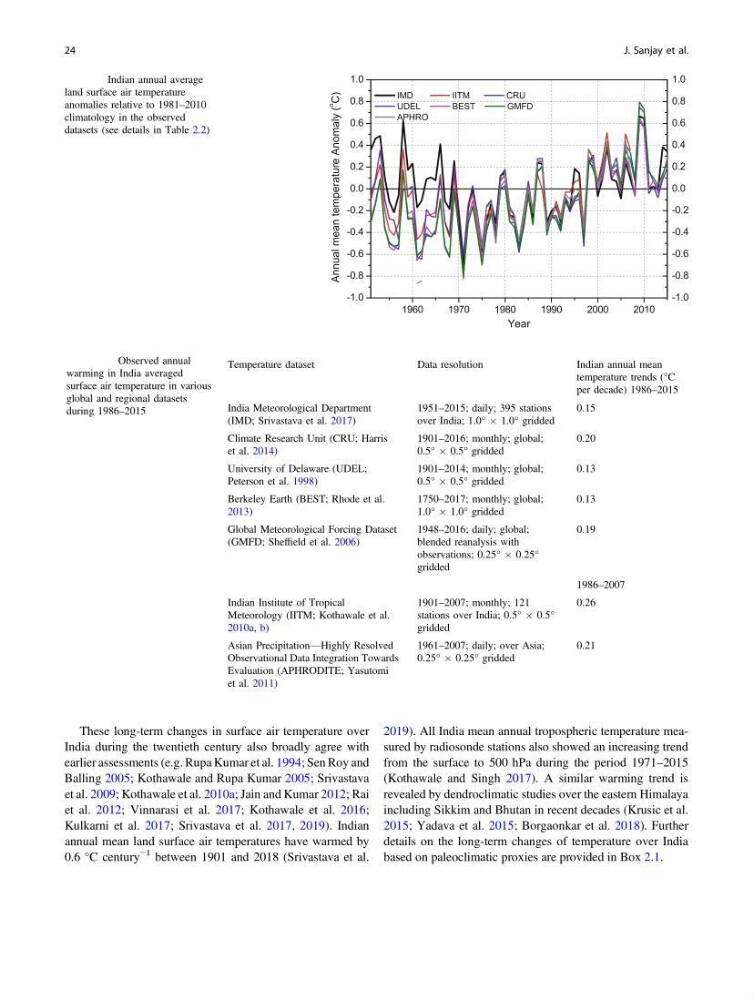
Fig. 2.2 Indian annual average
land surface air temperature
anomalies relative to 1981–2010
climatology in the observed
datasets (see details in Table 2.2)
Table 2.2 Observed annual
warming in India averaged
surface air temperature in various
global and regional datasets
during 1986–2015
Temperature dataset
Data resolution
Indian annual mean
temperature trends (°C
per decade) 1986–2015
India Meteorological Department
(IMD; Srivastava et al. 2017)
1951–2015; daily; 395 stations
over India; 1.0° Â 1.0° gridded
0.15
Climate Research Unit (CRU; Harris
et al. 2014)
1901–2016; monthly; global;
0.5° Â 0.5° gridded
0.20
University of Delaware (UDEL;
Peterson et al. 1998)
1901–2014; monthly; global;
0.5° Â 0.5° gridded
0.13
Berkeley Earth (BEST; Rhode et al.
2013)
1750–2017; monthly; global;
1.0° Â 1.0° gridded
0.13
Global Meteorological Forcing Dataset
(GMFD; Sheffield et al. 2006)
1948–2016; daily; global;
blended reanalysis with
observations; 0.25° Â 0.25°
gridded
0.19
1986–2007
Indian Institute of Tropical
Meteorology (IITM; Kothawale et al.
2010a, b)
1901–2007; monthly; 121
stations over India; 0.5° Â 0.5°
gridded
0.26
Asian Precipitation—Highly Resolved
Observational Data Integration Towards
Evaluation (APHRODITE; Yasutomi
et al. 2011)
1961–2007; daily; over Asia;
0.25° Â 0.25° gridded
0.21
24
J. Sanjay et al.
India during the twentieth century also broadly agree with
earlier assessments (e.g. Rupa Kumar et al. 1994; Sen Roy and
Balling 2005; Kothawale and Rupa Kumar 2005; Srivastava
et al. 2009; Kothawale et al. 2010a; Jain and Kumar 2012; Rai
et al. 2012; Vinnarasi et al. 2017; Kothawale et al. 2016;
Kulkarni et al. 2017; Srivastava et al. 2017, 2019). Indian
annual mean land surface air temperatures have warmed by
0.6 °C century
−1 between 1901 and 2018 (Srivastava et al.
2019). All India mean annual tropospheric temperature measured by radiosonde stations also showed an increasing trend
from the surface to 500 hPa during the period 1971–2015
(Kothawale and Singh 2017). A similar warming trend is
revealed by dendroclimatic studies over the eastern Himalaya
including Sikkim and Bhutan in recent decades (Krusic et al.
2015; Yadava et al. 2015; Borgaonkar et al. 2018). Further
details on the long-term changes of temperature over India
based on paleoclimatic proxies are provided in Box 2.1.
Fig. 2.2 Indian annual average
land surface air temperature
anomalies relative to 1981–2010
climatology in the observed
datasets (see details in Table 2.2)
Table 2.2 Observed annual
warming in India averaged
surface air temperature in various
global and regional datasets
during 1986–2015
Temperature dataset
Data resolution
Indian annual mean
temperature trends (°C
per decade) 1986–2015
India Meteorological Department
(IMD; Srivastava et al. 2017)
1951–2015; daily; 395 stations
over India; 1.0° Â 1.0° gridded
0.15
Climate Research Unit (CRU; Harris
et al. 2014)
1901–2016; monthly; global;
0.5° Â 0.5° gridded
0.20
University of Delaware (UDEL;
Peterson et al. 1998)
1901–2014; monthly; global;
0.5° Â 0.5° gridded
0.13
Berkeley Earth (BEST; Rhode et al.
2013)
1750–2017; monthly; global;
1.0° Â 1.0° gridded
0.13
Global Meteorological Forcing Dataset
(GMFD; Sheffield et al. 2006)
1948–2016; daily; global;
blended reanalysis with
observations; 0.25° Â 0.25°
gridded
0.19
1986–2007
Indian Institute of Tropical
Meteorology (IITM; Kothawale et al.
2010a, b)
1901–2007; monthly; 121
stations over India; 0.5° Â 0.5°
gridded
0.26
Asian Precipitation—Highly Resolved
Observational Data Integration Towards
Evaluation (APHRODITE; Yasutomi
et al. 2011)
1961–2007; daily; over Asia;
0.25° Â 0.25° gridded
0.21
24
J. Sanjay et al.