

Box 2.1 Trends Based on Tree-Ring Proxies
Palaeoclimatic records of temperature over monsoon
Asia are limited and mainly based on the tree-ring
proxies from the Himalayan region. Tree-ring based
reconstructions of summer climate (temperature and
rainfall) of Indian Himalaya, Nepal, Tibet, Karakoram
region of Himalaya did not show significant increasing
or decreasing trend during the past three to four centuries (Esper et al. 2002; Hughes 2001; Borgaonkar
et al. 1994, 1996; Pant et al. 1998; Yadav et al. 1999;
Cook et al. 2003; Thapa et al. 2015; Wu and Shao
1995). These reconstructions also indicated that the
Little Ice Age (LIA) phenomenon was not prominent
over this part of the Himalaya. However, few warm and
cold epochs were observed over the region. A millennium-long mean summer temperature reconstruction
from the monsoon-shadow zone in the western Himalaya (Yadav et al. 2011) indicated warming (Eleventh–
fifteenth century) and cooling episodes (Fiftieth–nineteenth century) followed by a warming trend in the
twentieth century. Higher growth in recent few decades
detected in the high altitude tree-ring chronology has
been noticed coinciding with the warming trend and
rapid retreat of the Himalayan glaciers (Borgaonkar
et al. 2009, 2011).
Dendroclimatic studies over the eastern Himalaya
including Sikkim and Bhutan have indicated a warming
trend in recent decades (Yadava et al. 2015; Borgaonkar
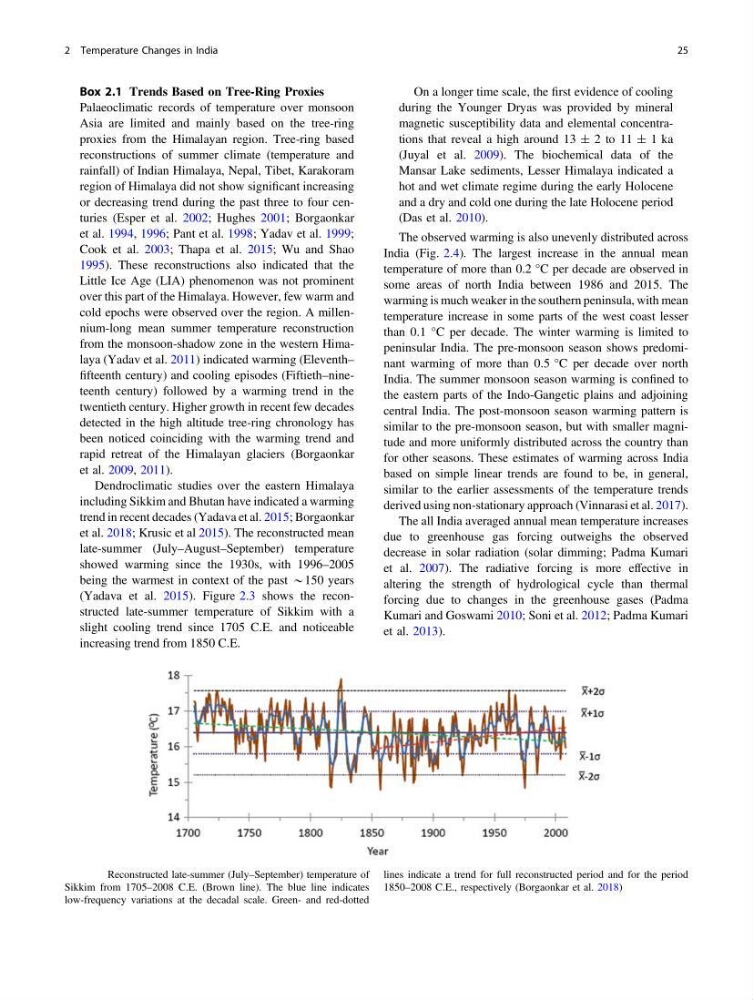
et al. 2018; Krusic et al 2015). The reconstructed mean
late-summer (July–August–September) temperature
showed warming since the 1930s, with 1996–2005
being the warmest in context of the past *150 years
(Yadava et al. 2015). Figure 2.3 shows the reconstructed late-summer temperature of Sikkim with a
slight cooling trend since 1705 C.E. and noticeable
increasing trend from 1850 C.E.
On a longer time scale, the first evidence of cooling
during the Younger Dryas was provided by mineral
magnetic susceptibility data and elemental concentrations that reveal a high around 13 ± 2 to 11 ± 1 ka
(Juyal et al. 2009). The biochemical data of the
Mansar Lake sediments, Lesser Himalaya indicated a
hot and wet climate regime during the early Holocene
and a dry and cold one during the late Holocene period
(Das et al. 2010).
The observed warming is also unevenly distributed across
India (Fig. 2.4). The largest increase in the annual mean
temperature of more than 0.2 °C per decade are observed in
some areas of north India between 1986 and 2015. The
warming is much weaker in the southern peninsula, with mean
temperature increase in some parts of the west coast lesser
than 0.1 °C per decade. The winter warming is limited to
peninsular India. The pre-monsoon season shows predominant warming of more than 0.5 °C per decade over north
India. The summer monsoon season warming is confined to
the eastern parts of the Indo-Gangetic plains and adjoining
central India. The post-monsoon season warming pattern is
similar to the pre-monsoon season, but with smaller magnitude and more uniformly distributed across the country than
for other seasons. These estimates of warming across India
based on simple linear trends are found to be, in general,
similar to the earlier assessments of the temperature trends
derived using non-stationary approach (Vinnarasi et al. 2017).
The all India averaged annual mean temperature increases
due to greenhouse gas forcing outweighs the observed
decrease in solar radiation (solar dimming; Padma Kumari
et al. 2007). The radiative forcing is more effective in
altering the strength of hydrological cycle than thermal
forcing due to changes in the greenhouse gases (Padma
Kumari and Goswami 2010; Soni et al. 2012; Padma Kumari
et al. 2013).
Fig. 2.3 Reconstructed late-summer (July–September) temperature of
Sikkim from 1705–2008 C.E. (Brown line). The blue line indicates
low-frequency variations at the decadal scale. Green- and red-dotted
lines indicate a trend for full reconstructed period and for the period
1850–2008 C.E., respectively (Borgaonkar et al. 2018)
2 Temperature Changes in India
25
Palaeoclimatic records of temperature over monsoon
Asia are limited and mainly based on the tree-ring
proxies from the Himalayan region. Tree-ring based
reconstructions of summer climate (temperature and
rainfall) of Indian Himalaya, Nepal, Tibet, Karakoram
region of Himalaya did not show significant increasing
or decreasing trend during the past three to four centuries (Esper et al. 2002; Hughes 2001; Borgaonkar
et al. 1994, 1996; Pant et al. 1998; Yadav et al. 1999;
Cook et al. 2003; Thapa et al. 2015; Wu and Shao
1995). These reconstructions also indicated that the
Little Ice Age (LIA) phenomenon was not prominent
over this part of the Himalaya. However, few warm and
cold epochs were observed over the region. A millennium-long mean summer temperature reconstruction
from the monsoon-shadow zone in the western Himalaya (Yadav et al. 2011) indicated warming (Eleventh–
fifteenth century) and cooling episodes (Fiftieth–nineteenth century) followed by a warming trend in the
twentieth century. Higher growth in recent few decades
detected in the high altitude tree-ring chronology has
been noticed coinciding with the warming trend and
rapid retreat of the Himalayan glaciers (Borgaonkar
et al. 2009, 2011).
Dendroclimatic studies over the eastern Himalaya
including Sikkim and Bhutan have indicated a warming
trend in recent decades (Yadava et al. 2015; Borgaonkar
et al. 2018; Krusic et al 2015). The reconstructed mean
late-summer (July–August–September) temperature
showed warming since the 1930s, with 1996–2005
being the warmest in context of the past *150 years
(Yadava et al. 2015). Figure 2.3 shows the reconstructed late-summer temperature of Sikkim with a
slight cooling trend since 1705 C.E. and noticeable
increasing trend from 1850 C.E.
On a longer time scale, the first evidence of cooling
during the Younger Dryas was provided by mineral
magnetic susceptibility data and elemental concentrations that reveal a high around 13 ± 2 to 11 ± 1 ka
(Juyal et al. 2009). The biochemical data of the
Mansar Lake sediments, Lesser Himalaya indicated a
hot and wet climate regime during the early Holocene
and a dry and cold one during the late Holocene period
(Das et al. 2010).
The observed warming is also unevenly distributed across
India (Fig. 2.4). The largest increase in the annual mean
temperature of more than 0.2 °C per decade are observed in
some areas of north India between 1986 and 2015. The
warming is much weaker in the southern peninsula, with mean
temperature increase in some parts of the west coast lesser
than 0.1 °C per decade. The winter warming is limited to
peninsular India. The pre-monsoon season shows predominant warming of more than 0.5 °C per decade over north
India. The summer monsoon season warming is confined to
the eastern parts of the Indo-Gangetic plains and adjoining
central India. The post-monsoon season warming pattern is
similar to the pre-monsoon season, but with smaller magnitude and more uniformly distributed across the country than
for other seasons. These estimates of warming across India
based on simple linear trends are found to be, in general,
similar to the earlier assessments of the temperature trends
derived using non-stationary approach (Vinnarasi et al. 2017).
The all India averaged annual mean temperature increases
due to greenhouse gas forcing outweighs the observed
decrease in solar radiation (solar dimming; Padma Kumari
et al. 2007). The radiative forcing is more effective in
altering the strength of hydrological cycle than thermal
forcing due to changes in the greenhouse gases (Padma
Kumari and Goswami 2010; Soni et al. 2012; Padma Kumari
et al. 2013).
Fig. 2.3 Reconstructed late-summer (July–September) temperature of
Sikkim from 1705–2008 C.E. (Brown line). The blue line indicates
low-frequency variations at the decadal scale. Green- and red-dotted
lines indicate a trend for full reconstructed period and for the period
1850–2008 C.E., respectively (Borgaonkar et al. 2018)
2 Temperature Changes in India
25