

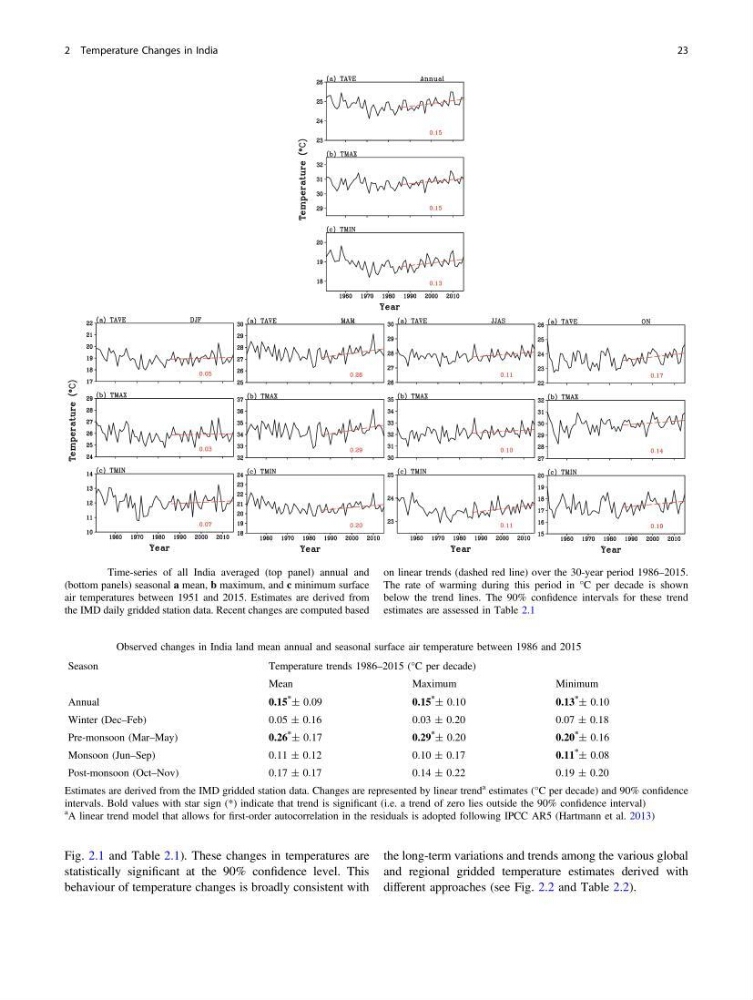
Fig. 2.1 and Table 2.1). These changes in temperatures are
statistically significant at the 90% confidence level. This
behaviour of temperature changes is broadly consistent with
the long-term variations and trends among the various global
and regional gridded temperature estimates derived with
different approaches (see Fig. 2.2 and Table 2.2).
Fig. 2.1 Time-series of all India averaged (top panel) annual and
(bottom panels) seasonal a mean, b maximum, and c minimum surface
air temperatures between 1951 and 2015. Estimates are derived from
the IMD daily gridded station data. Recent changes are computed based
on linear trends (dashed red line) over the 30-year period 1986–2015.
The rate of warming during this period in °C per decade is shown
below the trend lines. The 90% confidence intervals for these trend
estimates are assessed in Table 2.1
Table 2.1 Observed changes in India land mean annual and seasonal surface air temperature between 1986 and 2015
Season
Temperature trends 1986–2015 (°C per decade)
Mean
Maximum
Minimum
Annual
0.15
*
± 0.09
0.15
*
± 0.10
0.13
*
± 0.10
Winter (Dec–Feb)
0.05 ± 0.16
0.03 ± 0.20
0.07 ± 0.18
Pre-monsoon (Mar–May)
0.26
*
± 0.17
0.29
*
± 0.20
0.20
*
± 0.16
Monsoon (Jun–Sep)
0.11 ± 0.12
0.10 ± 0.17
0.11
*
± 0.08
Post-monsoon (Oct–Nov)
0.17 ± 0.17
0.14 ± 0.22
0.19 ± 0.20
Estimates are derived from the IMD gridded station data. Changes are represented by linear trend
a estimates (°C per decade) and 90% confidence
intervals. Bold values with star sign (*) indicate that trend is significant (i.e. a trend of zero lies outside the 90% confidence interval)
a A linear trend model that allows for first-order autocorrelation in the residuals is adopted following IPCC AR5 (Hartmann et al. 2013)
2 Temperature Changes in India
23
statistically significant at the 90% confidence level. This
behaviour of temperature changes is broadly consistent with
the long-term variations and trends among the various global
and regional gridded temperature estimates derived with
different approaches (see Fig. 2.2 and Table 2.2).
Fig. 2.1 Time-series of all India averaged (top panel) annual and
(bottom panels) seasonal a mean, b maximum, and c minimum surface
air temperatures between 1951 and 2015. Estimates are derived from
the IMD daily gridded station data. Recent changes are computed based
on linear trends (dashed red line) over the 30-year period 1986–2015.
The rate of warming during this period in °C per decade is shown
below the trend lines. The 90% confidence intervals for these trend
estimates are assessed in Table 2.1
Table 2.1 Observed changes in India land mean annual and seasonal surface air temperature between 1986 and 2015
Season
Temperature trends 1986–2015 (°C per decade)
Mean
Maximum
Minimum
Annual
0.15
*
± 0.09
0.15
*
± 0.10
0.13
*
± 0.10
Winter (Dec–Feb)
0.05 ± 0.16
0.03 ± 0.20
0.07 ± 0.18
Pre-monsoon (Mar–May)
0.26
*
± 0.17
0.29
*
± 0.20
0.20
*
± 0.16
Monsoon (Jun–Sep)
0.11 ± 0.12
0.10 ± 0.17
0.11
*
± 0.08
Post-monsoon (Oct–Nov)
0.17 ± 0.17
0.14 ± 0.22
0.19 ± 0.20
Estimates are derived from the IMD gridded station data. Changes are represented by linear trend
a estimates (°C per decade) and 90% confidence
intervals. Bold values with star sign (*) indicate that trend is significant (i.e. a trend of zero lies outside the 90% confidence interval)
a A linear trend model that allows for first-order autocorrelation in the residuals is adopted following IPCC AR5 (Hartmann et al. 2013)
2 Temperature Changes in India
23