

(Fig. 1.3b). However, regional precipitation patterns can
deviate significantly from the global mean, driven by different drivers of climate change like GHGs, aerosols, etc.
Precipitation projections from IITM-ESM and CMIP6
models show a gradual increase in global precipitation over
the twenty-first century (Fig. 1.3b). Global mean precipitation is projected to increase in IITM-ESM by more than 0.11
and 0.15 mm day
−1 by the end of the twenty-first century
(w.r.t 1850–1900) under the SSP2-4.5 and SSP5-8.5 scenarios. The precipitation is also projected to increase over
the Indian region in IITM-ESM and CMIP6 models under
both SSP5-8.5 and SS2-4.5 scenarios. The far future precipitation increase over the Indian region is 0.51 mm day
−1
under SSP5-8.5 and 0.03 mm day
−1 under SS2-4.5 as projected by IITM-ESM.
The AR5 assessment of changes in the ocean indicates
that the global ocean will warm in all scenarios. Thermal
expansion due to ocean warming and glacier melt have been
the dominant contributors to the twentieth-century global
mean sea-level rise (Church et al. 2013). The projected
changes in global mean sea level due to thermal expansion
(thermosteric sea level) are shown in Fig. 1.3c under
SSP2-4.5 and SSP5-8.5 scenarios. The global mean thermosteric sea level (TSL) from CMIP6 models shows an
increase, especially in the recent decades. The IITM-ESM
shows an increase in global mean TSL which is similar to
the TSL increase in other CMIP6 models. The global
mean TSL rise during the far future (2070–2099) will be
about 0.08 m–0.17 m under SSP2-4.5 and 0.11 m–0.23 m
under SSP5-8.5, respectively. The TSL projections from
IITM-ESM and other CMIP6 models indicate that the rate of
global mean sea-level rise for the twenty-first century will
exceed the rate observed during the historical period for
SSP2-4.5 and SSP5-8.5 scenarios.
We now assess changes in spatial patterns of surface
temperature and precipitation for the historical period
(1900–2014) and projections for far future (2070–2099)
based on IITM-ESM historical simulation and SSP5-8.5
scenario. Spatial patterns of surface temperature change
from IITM-ESM and NASA GISS surface temperature
analysis (GISSTEMPv4) w.r.t pre-industrial period are
shown in Fig. 1.4. Observations reveal increasing surface
temperatures over most of the continental region with
fastest-warming over the Arctic. Warming over land is
higher as compared to oceans. The anthropogenic warming
trend is reasonably well represented in IITM-ESM historical
simulation. The model simulates the Arctic amplification and
increasing temperature over west-central Asia while warming trends over Europe and east-central Asia are underestimated in the historical simulation. Spatial maps of annual
mean surface temperature changes in the far future (2070–
2099) in the SSP5-8.5 scenario show the largest warming
over high latitudes, particularly over the Arctic. As the
GMST continues to increase, it is very likely that by the end
of the twenty-first century most of the global land and ocean
areas will be warmer than during the historical period.
The spatial patterns of temperature change over the
Indian region are well simulated in IITM-ESM historical simulation. Larger warming pattern is seen over the
north and north-west India during the historical period
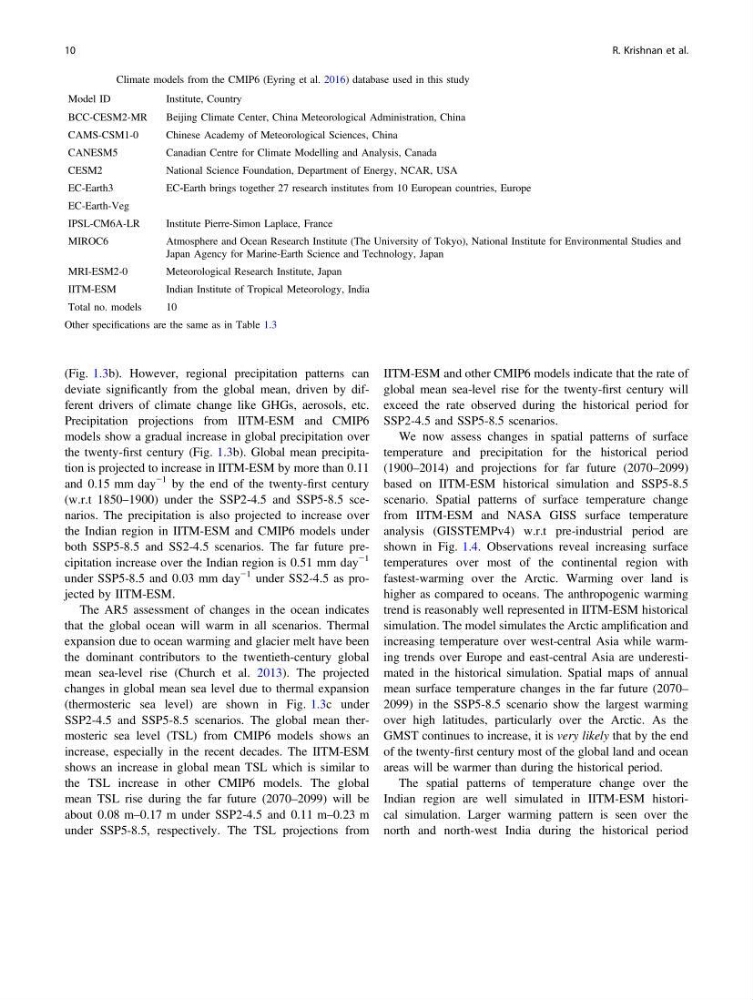
Table 1.4 Climate models from the CMIP6 (Eyring et al. 2016) database used in this study
Model ID
Institute, Country
BCC-CESM2-MR
Beijing Climate Center, China Meteorological Administration, China
CAMS-CSM1-0
Chinese Academy of Meteorological Sciences, China
CANESM5
Canadian Centre for Climate Modelling and Analysis, Canada
CESM2
National Science Foundation, Department of Energy, NCAR, USA
EC-Earth3
EC‐Earth brings together 27 research institutes from 10 European countries, Europe
EC-Earth-Veg
IPSL-CM6A-LR
Institute Pierre-Simon Laplace, France
MIROC6
Atmosphere and Ocean Research Institute (The University of Tokyo), National Institute for Environmental Studies and
Japan Agency for Marine-Earth Science and Technology, Japan
MRI-ESM2-0
Meteorological Research Institute, Japan
IITM-ESM
Indian Institute of Tropical Meteorology, India
Total no. models
10
Other specifications are the same as in Table 1.3
10
R. Krishnan et al.
deviate significantly from the global mean, driven by different drivers of climate change like GHGs, aerosols, etc.
Precipitation projections from IITM-ESM and CMIP6
models show a gradual increase in global precipitation over
the twenty-first century (Fig. 1.3b). Global mean precipitation is projected to increase in IITM-ESM by more than 0.11
and 0.15 mm day
−1 by the end of the twenty-first century
(w.r.t 1850–1900) under the SSP2-4.5 and SSP5-8.5 scenarios. The precipitation is also projected to increase over
the Indian region in IITM-ESM and CMIP6 models under
both SSP5-8.5 and SS2-4.5 scenarios. The far future precipitation increase over the Indian region is 0.51 mm day
−1
under SSP5-8.5 and 0.03 mm day
−1 under SS2-4.5 as projected by IITM-ESM.
The AR5 assessment of changes in the ocean indicates
that the global ocean will warm in all scenarios. Thermal
expansion due to ocean warming and glacier melt have been
the dominant contributors to the twentieth-century global
mean sea-level rise (Church et al. 2013). The projected
changes in global mean sea level due to thermal expansion
(thermosteric sea level) are shown in Fig. 1.3c under
SSP2-4.5 and SSP5-8.5 scenarios. The global mean thermosteric sea level (TSL) from CMIP6 models shows an
increase, especially in the recent decades. The IITM-ESM
shows an increase in global mean TSL which is similar to
the TSL increase in other CMIP6 models. The global
mean TSL rise during the far future (2070–2099) will be
about 0.08 m–0.17 m under SSP2-4.5 and 0.11 m–0.23 m
under SSP5-8.5, respectively. The TSL projections from
IITM-ESM and other CMIP6 models indicate that the rate of
global mean sea-level rise for the twenty-first century will
exceed the rate observed during the historical period for
SSP2-4.5 and SSP5-8.5 scenarios.
We now assess changes in spatial patterns of surface
temperature and precipitation for the historical period
(1900–2014) and projections for far future (2070–2099)
based on IITM-ESM historical simulation and SSP5-8.5
scenario. Spatial patterns of surface temperature change
from IITM-ESM and NASA GISS surface temperature
analysis (GISSTEMPv4) w.r.t pre-industrial period are
shown in Fig. 1.4. Observations reveal increasing surface
temperatures over most of the continental region with
fastest-warming over the Arctic. Warming over land is
higher as compared to oceans. The anthropogenic warming
trend is reasonably well represented in IITM-ESM historical
simulation. The model simulates the Arctic amplification and
increasing temperature over west-central Asia while warming trends over Europe and east-central Asia are underestimated in the historical simulation. Spatial maps of annual
mean surface temperature changes in the far future (2070–
2099) in the SSP5-8.5 scenario show the largest warming
over high latitudes, particularly over the Arctic. As the
GMST continues to increase, it is very likely that by the end
of the twenty-first century most of the global land and ocean
areas will be warmer than during the historical period.
The spatial patterns of temperature change over the
Indian region are well simulated in IITM-ESM historical simulation. Larger warming pattern is seen over the
north and north-west India during the historical period
Table 1.4 Climate models from the CMIP6 (Eyring et al. 2016) database used in this study
Model ID
Institute, Country
BCC-CESM2-MR
Beijing Climate Center, China Meteorological Administration, China
CAMS-CSM1-0
Chinese Academy of Meteorological Sciences, China
CANESM5
Canadian Centre for Climate Modelling and Analysis, Canada
CESM2
National Science Foundation, Department of Energy, NCAR, USA
EC-Earth3
EC‐Earth brings together 27 research institutes from 10 European countries, Europe
EC-Earth-Veg
IPSL-CM6A-LR
Institute Pierre-Simon Laplace, France
MIROC6
Atmosphere and Ocean Research Institute (The University of Tokyo), National Institute for Environmental Studies and
Japan Agency for Marine-Earth Science and Technology, Japan
MRI-ESM2-0
Meteorological Research Institute, Japan
IITM-ESM
Indian Institute of Tropical Meteorology, India
Total no. models
10
Other specifications are the same as in Table 1.3
10
R. Krishnan et al.