

is within the range of warming shown by other CMIP6
models during the historical period (Fig. 1.3a).
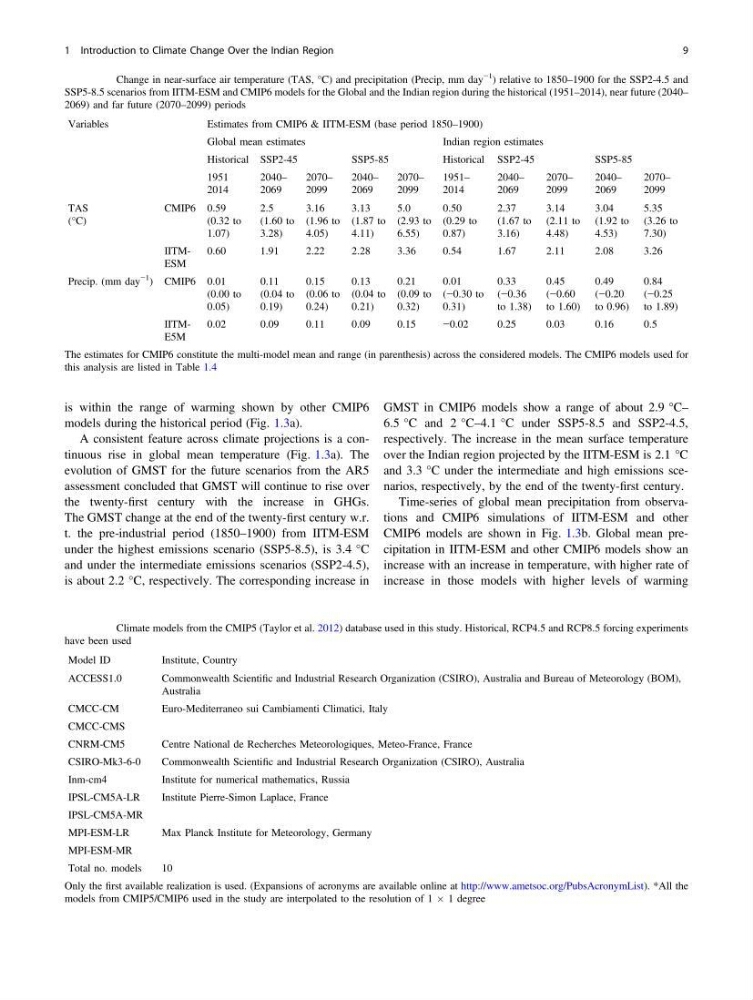
A consistent feature across climate projections is a continuous rise in global mean temperature (Fig. 1.3a). The
evolution of GMST for the future scenarios from the AR5
assessment concluded that GMST will continue to rise over
the twenty-first century with the increase in GHGs.
The GMST change at the end of the twenty-first century w.r.
t. the pre-industrial period (1850–1900) from IITM-ESM
under the highest emissions scenario (SSP5-8.5), is 3.4 °C
and under the intermediate emissions scenarios (SSP2-4.5),
is about 2.2 °C, respectively. The corresponding increase in
GMST in CMIP6 models show a range of about 2.9 °C–
6.5 °C and 2 °C–4.1 °C under SSP5-8.5 and SSP2-4.5,
respectively. The increase in the mean surface temperature
over the Indian region projected by the IITM-ESM is 2.1 °C
and 3.3 °C under the intermediate and high emissions scenarios, respectively, by the end of the twenty-first century.
Time-series of global mean precipitation from observations and CMIP6 simulations of IITM-ESM and other
CMIP6 models are shown in Fig. 1.3b. Global mean precipitation in IITM-ESM and other CMIP6 models show an
increase with an increase in temperature, with higher rate of
increase in those models with higher levels of warming
Table 1.2 Change in near-surface air temperature (TAS, °C) and precipitation (Precip, mm day
−1
) relative to 1850–1900 for the SSP2-4.5 and
SSP5-8.5 scenarios from IITM-ESM and CMIP6 models for the Global and the Indian region during the historical (1951–2014), near future (2040–
2069) and far future (2070–2099) periods
Variables
Estimates from CMIP6 & IITM-ESM (base period 1850–1900)
Global mean estimates
Indian region estimates
Historical SSP2-45
SSP5-85
Historical SSP2-45
SSP5-85
1951
2014
2040–
2069
2070–
2099
2040–
2069
2070–
2099
1951–
2014
2040–
2069
2070–
2099
2040–
2069
2070–
2099
TAS
(°C)
CMIP6 0.59
(0.32 to
1.07)
2.5
(1.60 to
3.28)
3.16
(1.96 to
4.05)
3.13
(1.87 to
4.11)
5.0
(2.93 to
6.55)
0.50
(0.29 to
0.87)
2.37
(1.67 to
3.16)
3.14
(2.11 to
4.48)
3.04
(1.92 to
4.53)
5.35
(3.26 to
7.30)
IITMESM
0.60
1.91
2.22
2.28
3.36
0.54
1.67
2.11
2.08
3.26
Precip. (mm day
−1
) CMIP6 0.01
(0.00 to
0.05)
0.11
(0.04 to
0.19)
0.15
(0.06 to
0.24)
0.13
(0.04 to
0.21)
0.21
(0.09 to
0.32)
0.01
(−0.30 to
0.31)
0.33
(−0.36
to 1.38)
0.45
(−0.60
to 1.60)
0.49
(−0.20
to 0.96)
0.84
(−0.25
to 1.89)
IITME5M
0.02
0.09
0.11
0.09
0.15
−0.02
0.25
0.03
0.16
0.5
The estimates for CMIP6 constitute the multi-model mean and range (in parenthesis) across the considered models. The CMIP6 models used for
this analysis are listed in Table 1.4
Table 1.3 Climate models from the CMIP5 (Taylor et al. 2012) database used in this study. Historical, RCP4.5 and RCP8.5 forcing experiments
have been used
Model ID
Institute, Country
ACCESS1.0
Commonwealth Scientific and Industrial Research Organization (CSIRO), Australia and Bureau of Meteorology (BOM),
Australia
CMCC-CM
Euro-Mediterraneo sui Cambiamenti Climatici, Italy
CMCC-CMS
CNRM-CM5
Centre National de Recherches Meteorologiques, Meteo-France, France
CSIRO-Mk3-6-0
Commonwealth Scientific and Industrial Research Organization (CSIRO), Australia
Inm-cm4
Institute for numerical mathematics, Russia
IPSL-CM5A-LR
Institute Pierre-Simon Laplace, France
IPSL-CM5A-MR
MPI-ESM-LR
Max Planck Institute for Meteorology, Germany
MPI-ESM-MR
Total no. models
10
Only the first available realization is used. (Expansions of acronyms are available online at http://www.ametsoc.org/PubsAcronymList). *All the
models from CMIP5/CMIP6 used in the study are interpolated to the resolution of 1 Â 1 degree
1 Introduction to Climate Change Over the Indian Region
9
models during the historical period (Fig. 1.3a).
A consistent feature across climate projections is a continuous rise in global mean temperature (Fig. 1.3a). The
evolution of GMST for the future scenarios from the AR5
assessment concluded that GMST will continue to rise over
the twenty-first century with the increase in GHGs.
The GMST change at the end of the twenty-first century w.r.
t. the pre-industrial period (1850–1900) from IITM-ESM
under the highest emissions scenario (SSP5-8.5), is 3.4 °C
and under the intermediate emissions scenarios (SSP2-4.5),
is about 2.2 °C, respectively. The corresponding increase in
GMST in CMIP6 models show a range of about 2.9 °C–
6.5 °C and 2 °C–4.1 °C under SSP5-8.5 and SSP2-4.5,
respectively. The increase in the mean surface temperature
over the Indian region projected by the IITM-ESM is 2.1 °C
and 3.3 °C under the intermediate and high emissions scenarios, respectively, by the end of the twenty-first century.
Time-series of global mean precipitation from observations and CMIP6 simulations of IITM-ESM and other
CMIP6 models are shown in Fig. 1.3b. Global mean precipitation in IITM-ESM and other CMIP6 models show an
increase with an increase in temperature, with higher rate of
increase in those models with higher levels of warming
Table 1.2 Change in near-surface air temperature (TAS, °C) and precipitation (Precip, mm day
−1
) relative to 1850–1900 for the SSP2-4.5 and
SSP5-8.5 scenarios from IITM-ESM and CMIP6 models for the Global and the Indian region during the historical (1951–2014), near future (2040–
2069) and far future (2070–2099) periods
Variables
Estimates from CMIP6 & IITM-ESM (base period 1850–1900)
Global mean estimates
Indian region estimates
Historical SSP2-45
SSP5-85
Historical SSP2-45
SSP5-85
1951
2014
2040–
2069
2070–
2099
2040–
2069
2070–
2099
1951–
2014
2040–
2069
2070–
2099
2040–
2069
2070–
2099
TAS
(°C)
CMIP6 0.59
(0.32 to
1.07)
2.5
(1.60 to
3.28)
3.16
(1.96 to
4.05)
3.13
(1.87 to
4.11)
5.0
(2.93 to
6.55)
0.50
(0.29 to
0.87)
2.37
(1.67 to
3.16)
3.14
(2.11 to
4.48)
3.04
(1.92 to
4.53)
5.35
(3.26 to
7.30)
IITMESM
0.60
1.91
2.22
2.28
3.36
0.54
1.67
2.11
2.08
3.26
Precip. (mm day
−1
) CMIP6 0.01
(0.00 to
0.05)
0.11
(0.04 to
0.19)
0.15
(0.06 to
0.24)
0.13
(0.04 to
0.21)
0.21
(0.09 to
0.32)
0.01
(−0.30 to
0.31)
0.33
(−0.36
to 1.38)
0.45
(−0.60
to 1.60)
0.49
(−0.20
to 0.96)
0.84
(−0.25
to 1.89)
IITME5M
0.02
0.09
0.11
0.09
0.15
−0.02
0.25
0.03
0.16
0.5
The estimates for CMIP6 constitute the multi-model mean and range (in parenthesis) across the considered models. The CMIP6 models used for
this analysis are listed in Table 1.4
Table 1.3 Climate models from the CMIP5 (Taylor et al. 2012) database used in this study. Historical, RCP4.5 and RCP8.5 forcing experiments
have been used
Model ID
Institute, Country
ACCESS1.0
Commonwealth Scientific and Industrial Research Organization (CSIRO), Australia and Bureau of Meteorology (BOM),
Australia
CMCC-CM
Euro-Mediterraneo sui Cambiamenti Climatici, Italy
CMCC-CMS
CNRM-CM5
Centre National de Recherches Meteorologiques, Meteo-France, France
CSIRO-Mk3-6-0
Commonwealth Scientific and Industrial Research Organization (CSIRO), Australia
Inm-cm4
Institute for numerical mathematics, Russia
IPSL-CM5A-LR
Institute Pierre-Simon Laplace, France
IPSL-CM5A-MR
MPI-ESM-LR
Max Planck Institute for Meteorology, Germany
MPI-ESM-MR
Total no. models
10
Only the first available realization is used. (Expansions of acronyms are available online at http://www.ametsoc.org/PubsAcronymList). *All the
models from CMIP5/CMIP6 used in the study are interpolated to the resolution of 1 Â 1 degree
1 Introduction to Climate Change Over the Indian Region
9