

RCP8.5 scenario (Church et al. 2013). The corresponding
increase in the thermosteric sea level is 0.2 m for RCP4.5
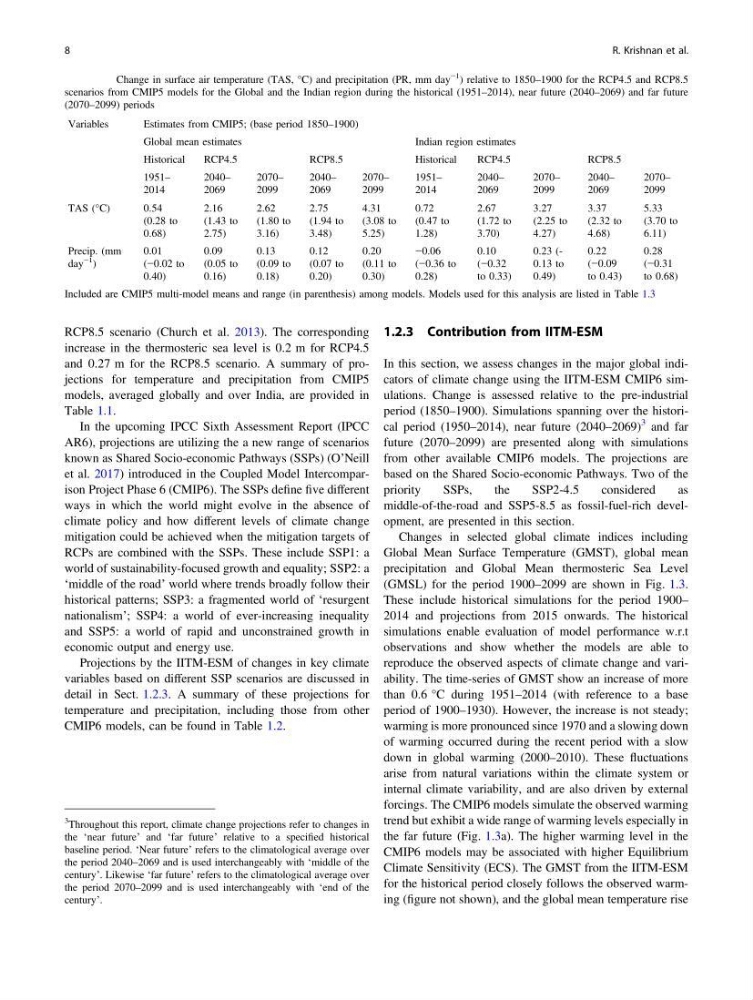
and 0.27 m for the RCP8.5 scenario. A summary of projections for temperature and precipitation from CMIP5
models, averaged globally and over India, are provided in
Table 1.1.
In the upcoming IPCC Sixth Assessment Report (IPCC
AR6), projections are utilizing the a new range of scenarios
known as Shared Socio-economic Pathways (SSPs) (O’Neill
et al. 2017) introduced in the Coupled Model Intercomparison Project Phase 6 (CMIP6). The SSPs define five different
ways in which the world might evolve in the absence of
climate policy and how different levels of climate change
mitigation could be achieved when the mitigation targets of
RCPs are combined with the SSPs. These include SSP1: a
world of sustainability-focused growth and equality; SSP2: a
‘middle of the road’ world where trends broadly follow their
historical patterns; SSP3: a fragmented world of ‘resurgent
nationalism’; SSP4: a world of ever-increasing inequality
and SSP5: a world of rapid and unconstrained growth in
economic output and energy use.
Projections by the IITM-ESM of changes in key climate
variables based on different SSP scenarios are discussed in
detail in Sect. 1.2.3. A summary of these projections for
temperature and precipitation, including those from other
CMIP6 models, can be found in Table 1.2.
1.2.3 Contribution from IITM-ESM
In this section, we assess changes in the major global indicators of climate change using the IITM-ESM CMIP6 simulations. Change is assessed relative to the pre-industrial
period (1850–1900). Simulations spanning over the historical period (1950–2014), near future (2040–2069)
3 and far
future (2070–2099) are presented along with simulations
from other available CMIP6 models. The projections are
based on the Shared Socio-economic Pathways. Two of the
priority
SSPs,
the
SSP2-4.5
considered
as
middle-of-the-road and SSP5-8.5 as fossil-fuel-rich development, are presented in this section.
Changes in selected global climate indices including
Global Mean Surface Temperature (GMST), global mean
precipitation and Global Mean thermosteric Sea Level
(GMSL) for the period 1900–2099 are shown in Fig. 1.3.
These include historical simulations for the period 1900–
2014 and projections from 2015 onwards. The historical
simulations enable evaluation of model performance w.r.t
observations and show whether the models are able to
reproduce the observed aspects of climate change and variability. The time-series of GMST show an increase of more
than 0.6 °C during 1951–2014 (with reference to a base
period of 1900–1930). However, the increase is not steady;
warming is more pronounced since 1970 and a slowing down
of warming occurred during the recent period with a slow
down in global warming (2000–2010). These fluctuations
arise from natural variations within the climate system or
internal climate variability, and are also driven by external
forcings. The CMIP6 models simulate the observed warming
trend but exhibit a wide range of warming levels especially in
the far future (Fig. 1.3a). The higher warming level in the
CMIP6 models may be associated with higher Equilibrium
Climate Sensitivity (ECS). The GMST from the IITM-ESM
for the historical period closely follows the observed warming (figure not shown), and the global mean temperature rise
Table 1.1 Change in surface air temperature (TAS, °C) and precipitation (PR, mm day
−1
) relative to 1850–1900 for the RCP4.5 and RCP8.5
scenarios from CMIP5 models for the Global and the Indian region during the historical (1951–2014), near future (2040–2069) and far future
(2070–2099) periods
Variables
Estimates from CMIP5; (base period 1850–1900)
Global mean estimates
Indian region estimates
Historical
RCP4.5
RCP8.5
Historical
RCP4.5
RCP8.5
1951–
2014
2040–
2069
2070–
2099
2040–
2069
2070–
2099
1951–
2014
2040–
2069
2070–
2099
2040–
2069
2070–
2099
TAS (°C)
0.54
(0.28 to
0.68)
2.16
(1.43 to
2.75)
2.62
(1.80 to
3.16)
2.75
(1.94 to
3.48)
4.31
(3.08 to
5.25)
0.72
(0.47 to
1.28)
2.67
(1.72 to
3.70)
3.27
(2.25 to
4.27)
3.37
(2.32 to
4.68)
5.33
(3.70 to
6.11)
Precip. (mm
day
−1
)
0.01
(−0.02 to
0.40)
0.09
(0.05 to
0.16)
0.13
(0.09 to
0.18)
0.12
(0.07 to
0.20)
0.20
(0.11 to
0.30)
−0.06
(−0.36 to
0.28)
0.10
(−0.32
to 0.33)
0.23 (0.13 to
0.49)
0.22
(−0.09
to 0.43)
0.28
(−0.31
to 0.68)
Included are CMIP5 multi-model means and range (in parenthesis) among models. Models used for this analysis are listed in Table 1.3
3
Throughout this report, climate change projections refer to changes in
the ‘near future’ and ‘far future’ relative to a specified historical
baseline period. ‘Near future’ refers to the climatological average over
the period 2040–2069 and is used interchangeably with ‘middle of the
century’. Likewise ‘far future’ refers to the climatological average over
the period 2070–2099 and is used interchangeably with ‘end of the
century’.
8
R. Krishnan et al.
increase in the thermosteric sea level is 0.2 m for RCP4.5
and 0.27 m for the RCP8.5 scenario. A summary of projections for temperature and precipitation from CMIP5
models, averaged globally and over India, are provided in
Table 1.1.
In the upcoming IPCC Sixth Assessment Report (IPCC
AR6), projections are utilizing the a new range of scenarios
known as Shared Socio-economic Pathways (SSPs) (O’Neill
et al. 2017) introduced in the Coupled Model Intercomparison Project Phase 6 (CMIP6). The SSPs define five different
ways in which the world might evolve in the absence of
climate policy and how different levels of climate change
mitigation could be achieved when the mitigation targets of
RCPs are combined with the SSPs. These include SSP1: a
world of sustainability-focused growth and equality; SSP2: a
‘middle of the road’ world where trends broadly follow their
historical patterns; SSP3: a fragmented world of ‘resurgent
nationalism’; SSP4: a world of ever-increasing inequality
and SSP5: a world of rapid and unconstrained growth in
economic output and energy use.
Projections by the IITM-ESM of changes in key climate
variables based on different SSP scenarios are discussed in
detail in Sect. 1.2.3. A summary of these projections for
temperature and precipitation, including those from other
CMIP6 models, can be found in Table 1.2.
1.2.3 Contribution from IITM-ESM
In this section, we assess changes in the major global indicators of climate change using the IITM-ESM CMIP6 simulations. Change is assessed relative to the pre-industrial
period (1850–1900). Simulations spanning over the historical period (1950–2014), near future (2040–2069)
3 and far
future (2070–2099) are presented along with simulations
from other available CMIP6 models. The projections are
based on the Shared Socio-economic Pathways. Two of the
priority
SSPs,
the
SSP2-4.5
considered
as
middle-of-the-road and SSP5-8.5 as fossil-fuel-rich development, are presented in this section.
Changes in selected global climate indices including
Global Mean Surface Temperature (GMST), global mean
precipitation and Global Mean thermosteric Sea Level
(GMSL) for the period 1900–2099 are shown in Fig. 1.3.
These include historical simulations for the period 1900–
2014 and projections from 2015 onwards. The historical
simulations enable evaluation of model performance w.r.t
observations and show whether the models are able to
reproduce the observed aspects of climate change and variability. The time-series of GMST show an increase of more
than 0.6 °C during 1951–2014 (with reference to a base
period of 1900–1930). However, the increase is not steady;
warming is more pronounced since 1970 and a slowing down
of warming occurred during the recent period with a slow
down in global warming (2000–2010). These fluctuations
arise from natural variations within the climate system or
internal climate variability, and are also driven by external
forcings. The CMIP6 models simulate the observed warming
trend but exhibit a wide range of warming levels especially in
the far future (Fig. 1.3a). The higher warming level in the
CMIP6 models may be associated with higher Equilibrium
Climate Sensitivity (ECS). The GMST from the IITM-ESM
for the historical period closely follows the observed warming (figure not shown), and the global mean temperature rise
Table 1.1 Change in surface air temperature (TAS, °C) and precipitation (PR, mm day
−1
) relative to 1850–1900 for the RCP4.5 and RCP8.5
scenarios from CMIP5 models for the Global and the Indian region during the historical (1951–2014), near future (2040–2069) and far future
(2070–2099) periods
Variables
Estimates from CMIP5; (base period 1850–1900)
Global mean estimates
Indian region estimates
Historical
RCP4.5
RCP8.5
Historical
RCP4.5
RCP8.5
1951–
2014
2040–
2069
2070–
2099
2040–
2069
2070–
2099
1951–
2014
2040–
2069
2070–
2099
2040–
2069
2070–
2099
TAS (°C)
0.54
(0.28 to
0.68)
2.16
(1.43 to
2.75)
2.62
(1.80 to
3.16)
2.75
(1.94 to
3.48)
4.31
(3.08 to
5.25)
0.72
(0.47 to
1.28)
2.67
(1.72 to
3.70)
3.27
(2.25 to
4.27)
3.37
(2.32 to
4.68)
5.33
(3.70 to
6.11)
Precip. (mm
day
−1
)
0.01
(−0.02 to
0.40)
0.09
(0.05 to
0.16)
0.13
(0.09 to
0.18)
0.12
(0.07 to
0.20)
0.20
(0.11 to
0.30)
−0.06
(−0.36 to
0.28)
0.10
(−0.32
to 0.33)
0.23 (0.13 to
0.49)
0.22
(−0.09
to 0.43)
0.28
(−0.31
to 0.68)
Included are CMIP5 multi-model means and range (in parenthesis) among models. Models used for this analysis are listed in Table 1.3
3
Throughout this report, climate change projections refer to changes in
the ‘near future’ and ‘far future’ relative to a specified historical
baseline period. ‘Near future’ refers to the climatological average over
the period 2040–2069 and is used interchangeably with ‘middle of the
century’. Likewise ‘far future’ refers to the climatological average over
the period 2070–2099 and is used interchangeably with ‘end of the
century’.
8
R. Krishnan et al.