

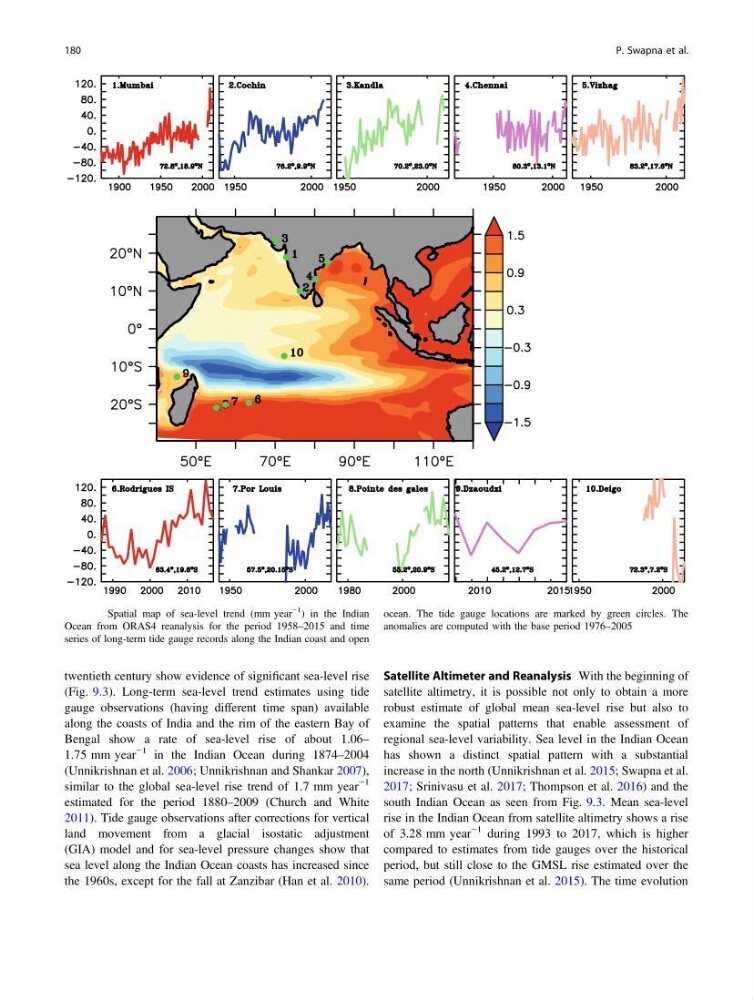
twentieth century show evidence of significant sea-level rise
(Fig. 9.3). Long-term sea-level trend estimates using tide
gauge observations (having different time span) available
along the coasts of India and the rim of the eastern Bay of
Bengal show a rate of sea-level rise of about 1.06–
1.75 mm year
−1 in the Indian Ocean during 1874–2004
(Unnikrishnan et al. 2006; Unnikrishnan and Shankar 2007),
similar to the global sea-level rise trend of 1.7 mm year
−1
estimated for the period 1880–2009 (Church and White
2011). Tide gauge observations after corrections for vertical
land movement from a glacial isostatic adjustment
(GIA) model and for sea-level pressure changes show that
sea level along the Indian Ocean coasts has increased since
the 1960s, except for the fall at Zanzibar (Han et al. 2010).
Satellite Altimeter and Reanalysis With the beginning of
satellite altimetry, it is possible not only to obtain a more
robust estimate of global mean sea-level rise but also to
examine the spatial patterns that enable assessment of
regional sea-level variability. Sea level in the Indian Ocean
has shown a distinct spatial pattern with a substantial
increase in the north (Unnikrishnan et al. 2015; Swapna et al.
2017; Srinivasu et al. 2017; Thompson et al. 2016) and the
south Indian Ocean as seen from Fig. 9.3. Mean sea-level
rise in the Indian Ocean from satellite altimetry shows a rise
of 3.28 mm year
−1 during 1993 to 2017, which is higher
compared to estimates from tide gauges over the historical
period, but still close to the GMSL rise estimated over the
same period (Unnikrishnan et al. 2015). The time evolution
Fig. 9.3 Spatial map of sea-level trend (mm year
−1
) in the Indian
Ocean from ORAS4 reanalysis for the period 1958–2015 and time
series of long-term tide gauge records along the Indian coast and open
ocean. The tide gauge locations are marked by green circles. The
anomalies are computed with the base period 1976–2005
180
P. Swapna et al.
(Fig. 9.3). Long-term sea-level trend estimates using tide
gauge observations (having different time span) available
along the coasts of India and the rim of the eastern Bay of
Bengal show a rate of sea-level rise of about 1.06–
1.75 mm year
−1 in the Indian Ocean during 1874–2004
(Unnikrishnan et al. 2006; Unnikrishnan and Shankar 2007),
similar to the global sea-level rise trend of 1.7 mm year
−1
estimated for the period 1880–2009 (Church and White
2011). Tide gauge observations after corrections for vertical
land movement from a glacial isostatic adjustment
(GIA) model and for sea-level pressure changes show that
sea level along the Indian Ocean coasts has increased since
the 1960s, except for the fall at Zanzibar (Han et al. 2010).
Satellite Altimeter and Reanalysis With the beginning of
satellite altimetry, it is possible not only to obtain a more
robust estimate of global mean sea-level rise but also to
examine the spatial patterns that enable assessment of
regional sea-level variability. Sea level in the Indian Ocean
has shown a distinct spatial pattern with a substantial
increase in the north (Unnikrishnan et al. 2015; Swapna et al.
2017; Srinivasu et al. 2017; Thompson et al. 2016) and the
south Indian Ocean as seen from Fig. 9.3. Mean sea-level
rise in the Indian Ocean from satellite altimetry shows a rise
of 3.28 mm year
−1 during 1993 to 2017, which is higher
compared to estimates from tide gauges over the historical
period, but still close to the GMSL rise estimated over the
same period (Unnikrishnan et al. 2015). The time evolution
Fig. 9.3 Spatial map of sea-level trend (mm year
−1
) in the Indian
Ocean from ORAS4 reanalysis for the period 1958–2015 and time
series of long-term tide gauge records along the Indian coast and open
ocean. The tide gauge locations are marked by green circles. The
anomalies are computed with the base period 1976–2005
180
P. Swapna et al.