

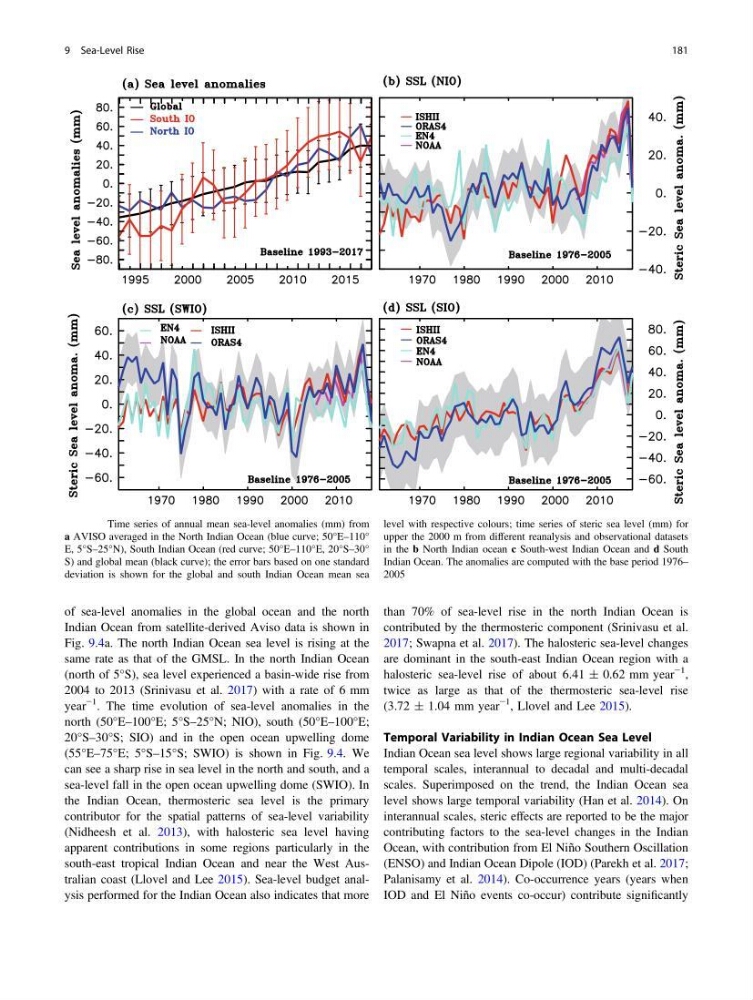
of sea-level anomalies in the global ocean and the north
Indian Ocean from satellite-derived Aviso data is shown in
Fig. 9.4a. The north Indian Ocean sea level is rising at the
same rate as that of the GMSL. In the north Indian Ocean
(north of 5°S), sea level experienced a basin-wide rise from
2004 to 2013 (Srinivasu et al. 2017) with a rate of 6 mm
year
−1 . The time evolution of sea-level anomalies in the
north (50°E–100°E; 5°S–25°N; NIO), south (50°E–100°E;
20°S–30°S; SIO) and in the open ocean upwelling dome
(55°E–75°E; 5°S–15°S; SWIO) is shown in Fig. 9.4. We
can see a sharp rise in sea level in the north and south, and a
sea-level fall in the open ocean upwelling dome (SWIO). In
the Indian Ocean, thermosteric sea level is the primary
contributor for the spatial patterns of sea-level variability
(Nidheesh et al. 2013), with halosteric sea level having
apparent contributions in some regions particularly in the
south-east tropical Indian Ocean and near the West Australian coast (Llovel and Lee 2015). Sea-level budget analysis performed for the Indian Ocean also indicates that more
than 70% of sea-level rise in the north Indian Ocean is
contributed by the thermosteric component (Srinivasu et al.
2017; Swapna et al. 2017). The halosteric sea-level changes
are dominant in the south-east Indian Ocean region with a
halosteric sea-level rise of about 6.41 ± 0.62 mm year
−1 ,
twice as large as that of the thermosteric sea-level rise
(3.72 ± 1.04 mm year
−1 , Llovel and Lee 2015).
Temporal Variability in Indian Ocean Sea Level
Indian Ocean sea level shows large regional variability in all
temporal scales, interannual to decadal and multi-decadal
scales. Superimposed on the trend, the Indian Ocean sea
level shows large temporal variability (Han et al. 2014). On
interannual scales, steric effects are reported to be the major
contributing factors to the sea-level changes in the Indian
Ocean, with contribution from El Niño Southern Oscillation
(ENSO) and Indian Ocean Dipole (IOD) (Parekh et al. 2017;
Palanisamy et al. 2014). Co-occurrence years (years when
IOD and El Niño events co-occur) contribute significantly
Fig. 9.4 Time series of annual mean sea-level anomalies (mm) from
a AVISO averaged in the North Indian Ocean (blue curve; 50°E–110°
E, 5°S–25°N), South Indian Ocean (red curve; 50°E–110°E, 20°S–30°
S) and global mean (black curve); the error bars based on one standard
deviation is shown for the global and south Indian Ocean mean sea
level with respective colours; time series of steric sea level (mm) for
upper the 2000 m from different reanalysis and observational datasets
in the b North Indian ocean c South-west Indian Ocean and d South
Indian Ocean. The anomalies are computed with the base period 1976–
2005
9 Sea-Level Rise
181
Indian Ocean from satellite-derived Aviso data is shown in
Fig. 9.4a. The north Indian Ocean sea level is rising at the
same rate as that of the GMSL. In the north Indian Ocean
(north of 5°S), sea level experienced a basin-wide rise from
2004 to 2013 (Srinivasu et al. 2017) with a rate of 6 mm
year
−1 . The time evolution of sea-level anomalies in the
north (50°E–100°E; 5°S–25°N; NIO), south (50°E–100°E;
20°S–30°S; SIO) and in the open ocean upwelling dome
(55°E–75°E; 5°S–15°S; SWIO) is shown in Fig. 9.4. We
can see a sharp rise in sea level in the north and south, and a
sea-level fall in the open ocean upwelling dome (SWIO). In
the Indian Ocean, thermosteric sea level is the primary
contributor for the spatial patterns of sea-level variability
(Nidheesh et al. 2013), with halosteric sea level having
apparent contributions in some regions particularly in the
south-east tropical Indian Ocean and near the West Australian coast (Llovel and Lee 2015). Sea-level budget analysis performed for the Indian Ocean also indicates that more
than 70% of sea-level rise in the north Indian Ocean is
contributed by the thermosteric component (Srinivasu et al.
2017; Swapna et al. 2017). The halosteric sea-level changes
are dominant in the south-east Indian Ocean region with a
halosteric sea-level rise of about 6.41 ± 0.62 mm year
−1 ,
twice as large as that of the thermosteric sea-level rise
(3.72 ± 1.04 mm year
−1 , Llovel and Lee 2015).
Temporal Variability in Indian Ocean Sea Level
Indian Ocean sea level shows large regional variability in all
temporal scales, interannual to decadal and multi-decadal
scales. Superimposed on the trend, the Indian Ocean sea
level shows large temporal variability (Han et al. 2014). On
interannual scales, steric effects are reported to be the major
contributing factors to the sea-level changes in the Indian
Ocean, with contribution from El Niño Southern Oscillation
(ENSO) and Indian Ocean Dipole (IOD) (Parekh et al. 2017;
Palanisamy et al. 2014). Co-occurrence years (years when
IOD and El Niño events co-occur) contribute significantly
Fig. 9.4 Time series of annual mean sea-level anomalies (mm) from
a AVISO averaged in the North Indian Ocean (blue curve; 50°E–110°
E, 5°S–25°N), South Indian Ocean (red curve; 50°E–110°E, 20°S–30°
S) and global mean (black curve); the error bars based on one standard
deviation is shown for the global and south Indian Ocean mean sea
level with respective colours; time series of steric sea level (mm) for
upper the 2000 m from different reanalysis and observational datasets
in the b North Indian ocean c South-west Indian Ocean and d South
Indian Ocean. The anomalies are computed with the base period 1976–
2005
9 Sea-Level Rise
181