

in May during pre-monsoon season (Fig. 8.3d). A few
studies also indicate that the trends in TC intensity over the
Atlantic Basin are more significant as compared to NIO
which has been ascribed to inadequate observational records
from the NIO region (Elsner et al. 2008; see also Walsh et al.
2016).
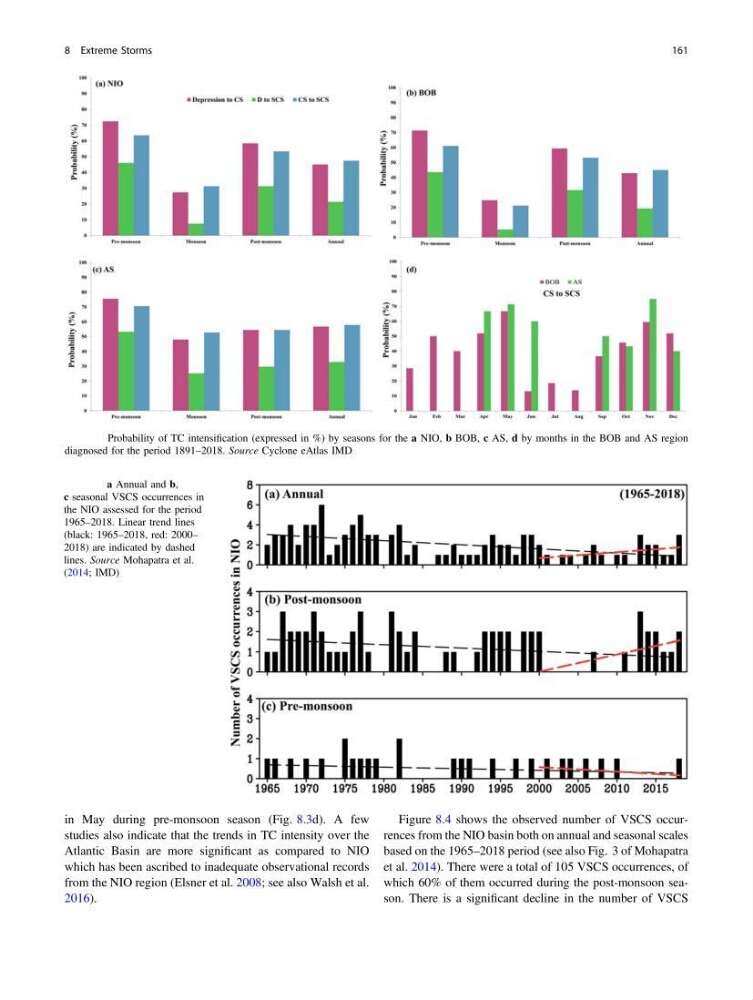
Figure 8.4 shows the observed number of VSCS occurrences from the NIO basin both on annual and seasonal scales
based on the 1965–2018 period (see also Fig. 3 of Mohapatra
et al. 2014). There were a total of 105 VSCS occurrences, of
which 60% of them occurred during the post-monsoon season. There is a significant decline in the number of VSCS
Fig. 8.3 Probability of TC intensification (expressed in %) by seasons for the a NIO, b BOB, c AS, d by months in the BOB and AS region
diagnosed for the period 1891–2018. Source Cyclone eAtlas IMD
Fig. 8.4 a Annual and b,
c seasonal VSCS occurrences in
the NIO assessed for the period
1965–2018. Linear trend lines
(black: 1965–2018, red: 2000–
2018) are indicated by dashed
lines. Source Mohapatra et al.
(2014; IMD)
8 Extreme Storms
161
studies also indicate that the trends in TC intensity over the
Atlantic Basin are more significant as compared to NIO
which has been ascribed to inadequate observational records
from the NIO region (Elsner et al. 2008; see also Walsh et al.
2016).
Figure 8.4 shows the observed number of VSCS occurrences from the NIO basin both on annual and seasonal scales
based on the 1965–2018 period (see also Fig. 3 of Mohapatra
et al. 2014). There were a total of 105 VSCS occurrences, of
which 60% of them occurred during the post-monsoon season. There is a significant decline in the number of VSCS
Fig. 8.3 Probability of TC intensification (expressed in %) by seasons for the a NIO, b BOB, c AS, d by months in the BOB and AS region
diagnosed for the period 1891–2018. Source Cyclone eAtlas IMD
Fig. 8.4 a Annual and b,
c seasonal VSCS occurrences in
the NIO assessed for the period
1965–2018. Linear trend lines
(black: 1965–2018, red: 2000–
2018) are indicated by dashed
lines. Source Mohapatra et al.
(2014; IMD)
8 Extreme Storms
161