

datasets also show a rising trend in TC frequency in the BOB
region particularly during the months of November and May
which is consistent with the earlier studies of Singh et al.
(2000, 2007).
Further, based on IMD long-period datasets, Singh et al.
(2000) identified a rise in intensification rates in the transformation of tropical disturbances into TCs and also a significant rise in SCS and VSCS in the NIO basin (see also
Mohanty et al. 2012). Figure 8.3 shows the probabilities of
TC intensification observed in the NIO basin, where one can
notice that intensification probability from tropical depression D to CS [CS to SCS] is about 45% [48%] on annual
scale. Also, there is a 21% [32%] probability of intensification from depression to extreme storm categories in the
BOB [AS] region on annual scale. On seasonal scale, there
are higher probabilities of transformation observed during
pre- and post-monsoon seasons, i.e., probability of transformation from D to CS is 72% and from CS to SCS is 64%
during the pre-monsoon season, and 58% for D to CS and
53% for CS to SCS during the post-monsoon season. There
is only a 27% probability for the transformations from D to
CS and from CS to SCS during the ISM season. Although
the number of storms in the AS region is relatively smaller
than observed in the BOB region, the probabilities of
transformation from [D to CS] CS to SCS are [33%] 27%
larger in AS compared to BOB. While the translational
speeds are larger for VSCS and SuCS categories (Chinchole
and Mohapatra 2017; see also Kossin 2018), the intensification rates in the NIO basin were found to be rather pronounced in November during the post-monsoon season and
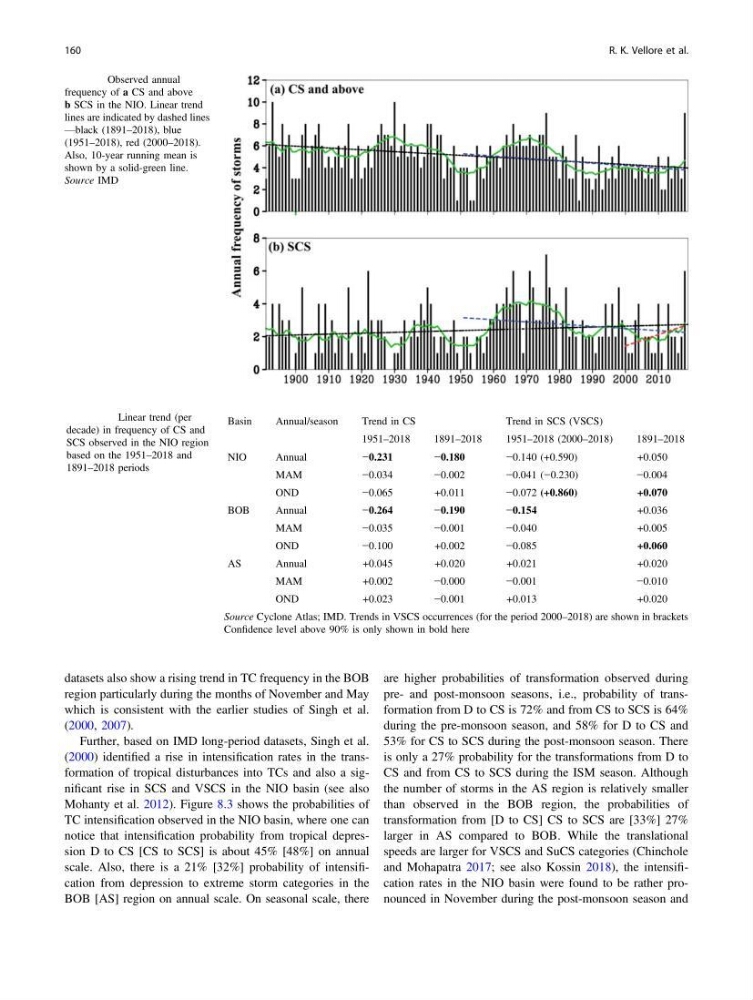
Fig. 8.2 Observed annual
frequency of a CS and above
b SCS in the NIO. Linear trend
lines are indicated by dashed lines
—black (1891–2018), blue
(1951–2018), red (2000–2018).
Also, 10-year running mean is
shown by a solid-green line.
Source IMD
Table 8.4 Linear trend (per
decade) in frequency of CS and
SCS observed in the NIO region
based on the 1951–2018 and
1891–2018 periods
Basin
Annual/season
Trend in CS
Trend in SCS (VSCS)
1951–2018
1891–2018
1951–2018 (2000–2018)
1891–2018
NIO
Annual
−0.231
−0.180
−0.140 (+0.590)
+0.050
MAM
−0.034
−0.002
−0.041 (−0.230)
−0.004
OND
−0.065
+0.011
−0.072 (+0.860)
+0.070
BOB
Annual
−0.264
−0.190
−0.154
+0.036
MAM
−0.035
−0.001
−0.040
+0.005
OND
−0.100
+0.002
−0.085
+0.060
AS
Annual
+0.045
+0.020
+0.021
+0.020
MAM
+0.002
−0.000
−0.001
−0.010
OND
+0.023
−0.001
+0.013
+0.020
Source Cyclone Atlas; IMD. Trends in VSCS occurrences (for the period 2000–2018) are shown in brackets
Confidence level above 90% is only shown in bold here
160
R. K. Vellore et al.
region particularly during the months of November and May
which is consistent with the earlier studies of Singh et al.
(2000, 2007).
Further, based on IMD long-period datasets, Singh et al.
(2000) identified a rise in intensification rates in the transformation of tropical disturbances into TCs and also a significant rise in SCS and VSCS in the NIO basin (see also
Mohanty et al. 2012). Figure 8.3 shows the probabilities of
TC intensification observed in the NIO basin, where one can
notice that intensification probability from tropical depression D to CS [CS to SCS] is about 45% [48%] on annual
scale. Also, there is a 21% [32%] probability of intensification from depression to extreme storm categories in the
BOB [AS] region on annual scale. On seasonal scale, there
are higher probabilities of transformation observed during
pre- and post-monsoon seasons, i.e., probability of transformation from D to CS is 72% and from CS to SCS is 64%
during the pre-monsoon season, and 58% for D to CS and
53% for CS to SCS during the post-monsoon season. There
is only a 27% probability for the transformations from D to
CS and from CS to SCS during the ISM season. Although
the number of storms in the AS region is relatively smaller
than observed in the BOB region, the probabilities of
transformation from [D to CS] CS to SCS are [33%] 27%
larger in AS compared to BOB. While the translational
speeds are larger for VSCS and SuCS categories (Chinchole
and Mohapatra 2017; see also Kossin 2018), the intensification rates in the NIO basin were found to be rather pronounced in November during the post-monsoon season and
Fig. 8.2 Observed annual
frequency of a CS and above
b SCS in the NIO. Linear trend
lines are indicated by dashed lines
—black (1891–2018), blue
(1951–2018), red (2000–2018).
Also, 10-year running mean is
shown by a solid-green line.
Source IMD
Table 8.4 Linear trend (per
decade) in frequency of CS and
SCS observed in the NIO region
based on the 1951–2018 and
1891–2018 periods
Basin
Annual/season
Trend in CS
Trend in SCS (VSCS)
1951–2018
1891–2018
1951–2018 (2000–2018)
1891–2018
NIO
Annual
−0.231
−0.180
−0.140 (+0.590)
+0.050
MAM
−0.034
−0.002
−0.041 (−0.230)
−0.004
OND
−0.065
+0.011
−0.072 (+0.860)
+0.070
BOB
Annual
−0.264
−0.190
−0.154
+0.036
MAM
−0.035
−0.001
−0.040
+0.005
OND
−0.100
+0.002
−0.085
+0.060
AS
Annual
+0.045
+0.020
+0.021
+0.020
MAM
+0.002
−0.000
−0.001
−0.010
OND
+0.023
−0.001
+0.013
+0.020
Source Cyclone Atlas; IMD. Trends in VSCS occurrences (for the period 2000–2018) are shown in brackets
Confidence level above 90% is only shown in bold here
160
R. K. Vellore et al.