

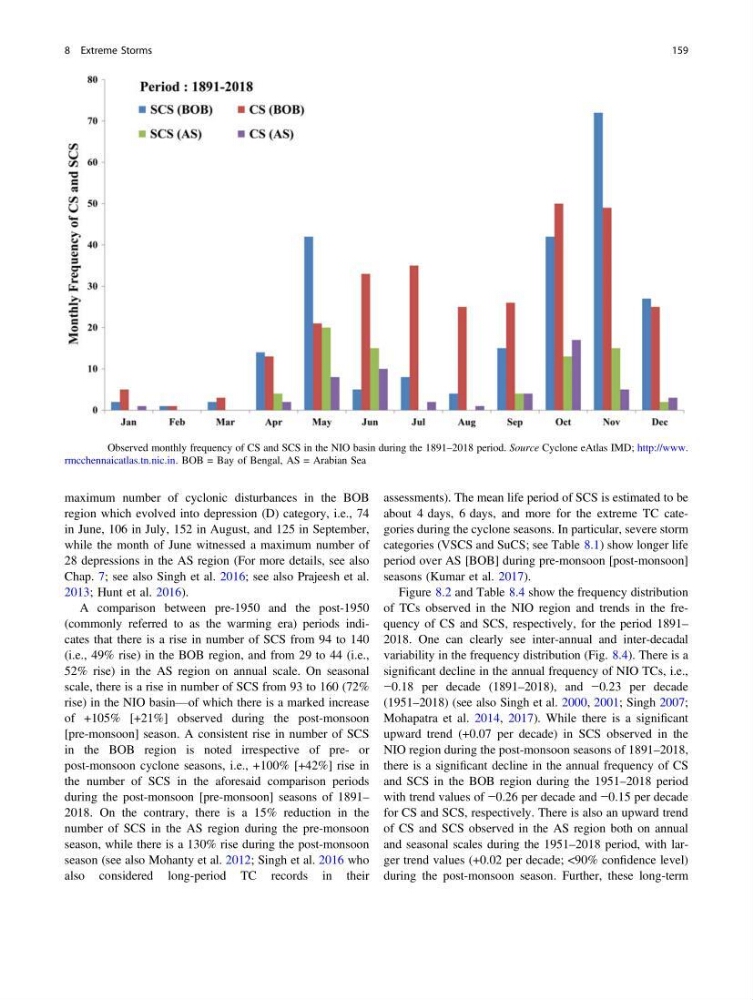
maximum number of cyclonic disturbances in the BOB
region which evolved into depression (D) category, i.e., 74
in June, 106 in July, 152 in August, and 125 in September,
while the month of June witnessed a maximum number of
28 depressions in the AS region (For more details, see also
Chap. 7; see also Singh et al. 2016; see also Prajeesh et al.
2013; Hunt et al. 2016).
A comparison between pre-1950 and the post-1950
(commonly referred to as the warming era) periods indicates that there is a rise in number of SCS from 94 to 140
(i.e., 49% rise) in the BOB region, and from 29 to 44 (i.e.,
52% rise) in the AS region on annual scale. On seasonal
scale, there is a rise in number of SCS from 93 to 160 (72%
rise) in the NIO basin—of which there is a marked increase
of +105% [+21%] observed during the post-monsoon
[pre-monsoon] season. A consistent rise in number of SCS
in the BOB region is noted irrespective of pre- or
post-monsoon cyclone seasons, i.e., +100% [+42%] rise in
the number of SCS in the aforesaid comparison periods
during the post-monsoon [pre-monsoon] seasons of 1891–
2018. On the contrary, there is a 15% reduction in the
number of SCS in the AS region during the pre-monsoon
season, while there is a 130% rise during the post-monsoon
season (see also Mohanty et al. 2012; Singh et al. 2016 who
also considered long-period TC records in their
assessments). The mean life period of SCS is estimated to be
about 4 days, 6 days, and more for the extreme TC categories during the cyclone seasons. In particular, severe storm
categories (VSCS and SuCS; see Table 8.1) show longer life
period over AS [BOB] during pre-monsoon [post-monsoon]
seasons (Kumar et al. 2017).
Figure 8.2 and Table 8.4 show the frequency distribution
of TCs observed in the NIO region and trends in the frequency of CS and SCS, respectively, for the period 1891–
2018. One can clearly see inter-annual and inter-decadal
variability in the frequency distribution (Fig. 8.4). There is a
significant decline in the annual frequency of NIO TCs, i.e.,
−0.18 per decade (1891–2018), and −0.23 per decade
(1951–2018) (see also Singh et al. 2000, 2001; Singh 2007;
Mohapatra et al. 2014, 2017). While there is a significant
upward trend (+0.07 per decade) in SCS observed in the
NIO region during the post-monsoon seasons of 1891–2018,
there is a significant decline in the annual frequency of CS
and SCS in the BOB region during the 1951–2018 period
with trend values of −0.26 per decade and −0.15 per decade
for CS and SCS, respectively. There is also an upward trend
of CS and SCS observed in the AS region both on annual
and seasonal scales during the 1951–2018 period, with larger trend values (+0.02 per decade; <90% confidence level)
during the post-monsoon season. Further, these long-term
Fig. 8.1 Observed monthly frequency of CS and SCS in the NIO basin during the 1891–2018 period. Source Cyclone eAtlas IMD; http://www.
rmcchennaicatlas.tn.nic.in. BOB = Bay of Bengal, AS = Arabian Sea
8 Extreme Storms
159
region which evolved into depression (D) category, i.e., 74
in June, 106 in July, 152 in August, and 125 in September,
while the month of June witnessed a maximum number of
28 depressions in the AS region (For more details, see also
Chap. 7; see also Singh et al. 2016; see also Prajeesh et al.
2013; Hunt et al. 2016).
A comparison between pre-1950 and the post-1950
(commonly referred to as the warming era) periods indicates that there is a rise in number of SCS from 94 to 140
(i.e., 49% rise) in the BOB region, and from 29 to 44 (i.e.,
52% rise) in the AS region on annual scale. On seasonal
scale, there is a rise in number of SCS from 93 to 160 (72%
rise) in the NIO basin—of which there is a marked increase
of +105% [+21%] observed during the post-monsoon
[pre-monsoon] season. A consistent rise in number of SCS
in the BOB region is noted irrespective of pre- or
post-monsoon cyclone seasons, i.e., +100% [+42%] rise in
the number of SCS in the aforesaid comparison periods
during the post-monsoon [pre-monsoon] seasons of 1891–
2018. On the contrary, there is a 15% reduction in the
number of SCS in the AS region during the pre-monsoon
season, while there is a 130% rise during the post-monsoon
season (see also Mohanty et al. 2012; Singh et al. 2016 who
also considered long-period TC records in their
assessments). The mean life period of SCS is estimated to be
about 4 days, 6 days, and more for the extreme TC categories during the cyclone seasons. In particular, severe storm
categories (VSCS and SuCS; see Table 8.1) show longer life
period over AS [BOB] during pre-monsoon [post-monsoon]
seasons (Kumar et al. 2017).
Figure 8.2 and Table 8.4 show the frequency distribution
of TCs observed in the NIO region and trends in the frequency of CS and SCS, respectively, for the period 1891–
2018. One can clearly see inter-annual and inter-decadal
variability in the frequency distribution (Fig. 8.4). There is a
significant decline in the annual frequency of NIO TCs, i.e.,
−0.18 per decade (1891–2018), and −0.23 per decade
(1951–2018) (see also Singh et al. 2000, 2001; Singh 2007;
Mohapatra et al. 2014, 2017). While there is a significant
upward trend (+0.07 per decade) in SCS observed in the
NIO region during the post-monsoon seasons of 1891–2018,
there is a significant decline in the annual frequency of CS
and SCS in the BOB region during the 1951–2018 period
with trend values of −0.26 per decade and −0.15 per decade
for CS and SCS, respectively. There is also an upward trend
of CS and SCS observed in the AS region both on annual
and seasonal scales during the 1951–2018 period, with larger trend values (+0.02 per decade; <90% confidence level)
during the post-monsoon season. Further, these long-term
Fig. 8.1 Observed monthly frequency of CS and SCS in the NIO basin during the 1891–2018 period. Source Cyclone eAtlas IMD; http://www.
rmcchennaicatlas.tn.nic.in. BOB = Bay of Bengal, AS = Arabian Sea
8 Extreme Storms
159