

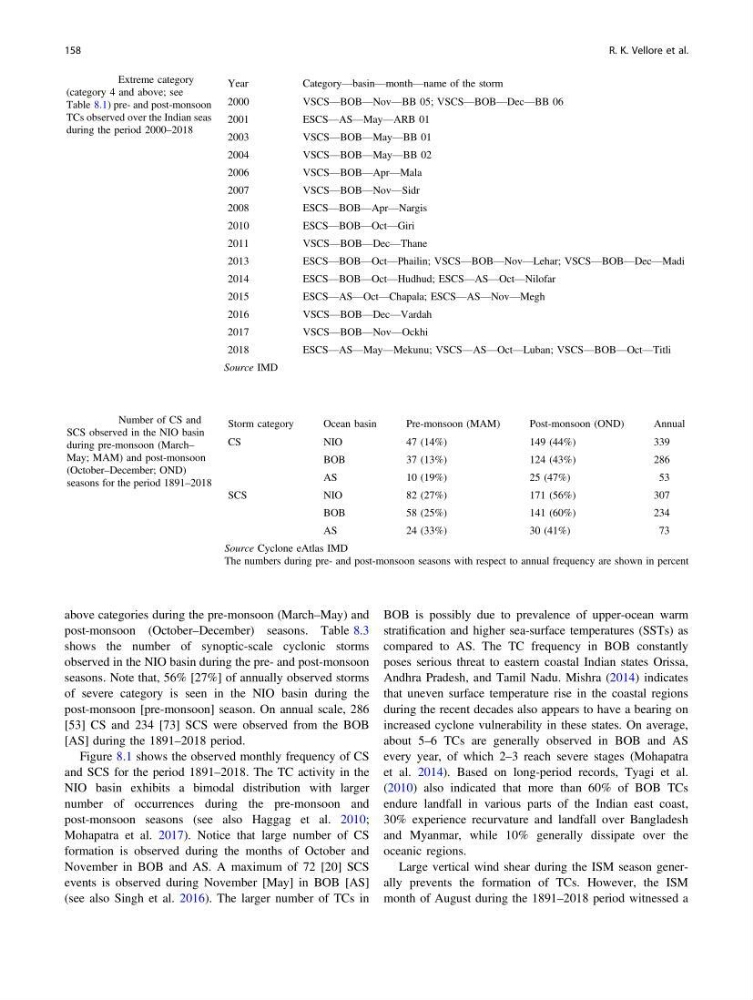
above categories during the pre-monsoon (March–May) and
post-monsoon (October–December) seasons. Table 8.3
shows the number of synoptic-scale cyclonic storms
observed in the NIO basin during the pre- and post-monsoon
seasons. Note that, 56% [27%] of annually observed storms
of severe category is seen in the NIO basin during the
post-monsoon [pre-monsoon] season. On annual scale, 286
[53] CS and 234 [73] SCS were observed from the BOB
[AS] during the 1891–2018 period.
Figure 8.1 shows the observed monthly frequency of CS
and SCS for the period 1891–2018. The TC activity in the
NIO basin exhibits a bimodal distribution with larger
number of occurrences during the pre-monsoon and
post-monsoon seasons (see also Haggag et al. 2010;
Mohapatra et al. 2017). Notice that large number of CS
formation is observed during the months of October and
November in BOB and AS. A maximum of 72 [20] SCS
events is observed during November [May] in BOB [AS]
(see also Singh et al. 2016). The larger number of TCs in
BOB is possibly due to prevalence of upper-ocean warm
stratification and higher sea-surface temperatures (SSTs) as
compared to AS. The TC frequency in BOB constantly
poses serious threat to eastern coastal Indian states Orissa,
Andhra Pradesh, and Tamil Nadu. Mishra (2014) indicates
that uneven surface temperature rise in the coastal regions
during the recent decades also appears to have a bearing on
increased cyclone vulnerability in these states. On average,
about 5–6 TCs are generally observed in BOB and AS
every year, of which 2–3 reach severe stages (Mohapatra
et al. 2014). Based on long-period records, Tyagi et al.
(2010) also indicated that more than 60% of BOB TCs
endure landfall in various parts of the Indian east coast,
30% experience recurvature and landfall over Bangladesh
and Myanmar, while 10% generally dissipate over the
oceanic regions.
Large vertical wind shear during the ISM season generally prevents the formation of TCs. However, the ISM
month of August during the 1891–2018 period witnessed a
Table 8.2 Extreme category
(category 4 and above; see
Table 8.1) pre- and post-monsoon
TCs observed over the Indian seas
during the period 2000–2018
Year
Category—basin—month—name of the storm
2000
VSCS—BOB—Nov—BB 05; VSCS—BOB—Dec—BB 06
2001
ESCS—AS—May—ARB 01
2003
VSCS—BOB—May—BB 01
2004
VSCS—BOB—May—BB 02
2006
VSCS—BOB—Apr—Mala
2007
VSCS—BOB—Nov—Sidr
2008
ESCS—BOB—Apr—Nargis
2010
ESCS—BOB—Oct—Giri
2011
VSCS—BOB—Dec—Thane
2013
ESCS—BOB—Oct—Phailin; VSCS—BOB—Nov—Lehar; VSCS—BOB—Dec—Madi
2014
ESCS—BOB—Oct—Hudhud; ESCS—AS—Oct—Nilofar
2015
ESCS—AS—Oct—Chapala; ESCS—AS—Nov—Megh
2016
VSCS—BOB—Dec—Vardah
2017
VSCS—BOB—Nov—Ockhi
2018
ESCS—AS—May—Mekunu; VSCS—AS—Oct—Luban; VSCS—BOB—Oct—Titli
Source IMD
Table 8.3 Number of CS and
SCS observed in the NIO basin
during pre-monsoon (March–
May; MAM) and post-monsoon
(October–December; OND)
seasons for the period 1891–2018
Storm category
Ocean basin
Pre-monsoon (MAM)
Post-monsoon (OND)
Annual
CS
NIO
47 (14%)
149 (44%)
339
BOB
37 (13%)
124 (43%)
286
AS
10 (19%)
25 (47%)
53
SCS
NIO
82 (27%)
171 (56%)
307
BOB
58 (25%)
141 (60%)
234
AS
24 (33%)
30 (41%)
73
Source Cyclone eAtlas IMD
The numbers during pre- and post-monsoon seasons with respect to annual frequency are shown in percent
158
R. K. Vellore et al.
post-monsoon (October–December) seasons. Table 8.3
shows the number of synoptic-scale cyclonic storms
observed in the NIO basin during the pre- and post-monsoon
seasons. Note that, 56% [27%] of annually observed storms
of severe category is seen in the NIO basin during the
post-monsoon [pre-monsoon] season. On annual scale, 286
[53] CS and 234 [73] SCS were observed from the BOB
[AS] during the 1891–2018 period.
Figure 8.1 shows the observed monthly frequency of CS
and SCS for the period 1891–2018. The TC activity in the
NIO basin exhibits a bimodal distribution with larger
number of occurrences during the pre-monsoon and
post-monsoon seasons (see also Haggag et al. 2010;
Mohapatra et al. 2017). Notice that large number of CS
formation is observed during the months of October and
November in BOB and AS. A maximum of 72 [20] SCS
events is observed during November [May] in BOB [AS]
(see also Singh et al. 2016). The larger number of TCs in
BOB is possibly due to prevalence of upper-ocean warm
stratification and higher sea-surface temperatures (SSTs) as
compared to AS. The TC frequency in BOB constantly
poses serious threat to eastern coastal Indian states Orissa,
Andhra Pradesh, and Tamil Nadu. Mishra (2014) indicates
that uneven surface temperature rise in the coastal regions
during the recent decades also appears to have a bearing on
increased cyclone vulnerability in these states. On average,
about 5–6 TCs are generally observed in BOB and AS
every year, of which 2–3 reach severe stages (Mohapatra
et al. 2014). Based on long-period records, Tyagi et al.
(2010) also indicated that more than 60% of BOB TCs
endure landfall in various parts of the Indian east coast,
30% experience recurvature and landfall over Bangladesh
and Myanmar, while 10% generally dissipate over the
oceanic regions.
Large vertical wind shear during the ISM season generally prevents the formation of TCs. However, the ISM
month of August during the 1891–2018 period witnessed a
Table 8.2 Extreme category
(category 4 and above; see
Table 8.1) pre- and post-monsoon
TCs observed over the Indian seas
during the period 2000–2018
Year
Category—basin—month—name of the storm
2000
VSCS—BOB—Nov—BB 05; VSCS—BOB—Dec—BB 06
2001
ESCS—AS—May—ARB 01
2003
VSCS—BOB—May—BB 01
2004
VSCS—BOB—May—BB 02
2006
VSCS—BOB—Apr—Mala
2007
VSCS—BOB—Nov—Sidr
2008
ESCS—BOB—Apr—Nargis
2010
ESCS—BOB—Oct—Giri
2011
VSCS—BOB—Dec—Thane
2013
ESCS—BOB—Oct—Phailin; VSCS—BOB—Nov—Lehar; VSCS—BOB—Dec—Madi
2014
ESCS—BOB—Oct—Hudhud; ESCS—AS—Oct—Nilofar
2015
ESCS—AS—Oct—Chapala; ESCS—AS—Nov—Megh
2016
VSCS—BOB—Dec—Vardah
2017
VSCS—BOB—Nov—Ockhi
2018
ESCS—AS—May—Mekunu; VSCS—AS—Oct—Luban; VSCS—BOB—Oct—Titli
Source IMD
Table 8.3 Number of CS and
SCS observed in the NIO basin
during pre-monsoon (March–
May; MAM) and post-monsoon
(October–December; OND)
seasons for the period 1891–2018
Storm category
Ocean basin
Pre-monsoon (MAM)
Post-monsoon (OND)
Annual
CS
NIO
47 (14%)
149 (44%)
339
BOB
37 (13%)
124 (43%)
286
AS
10 (19%)
25 (47%)
53
SCS
NIO
82 (27%)
171 (56%)
307
BOB
58 (25%)
141 (60%)
234
AS
24 (33%)
30 (41%)
73
Source Cyclone eAtlas IMD
The numbers during pre- and post-monsoon seasons with respect to annual frequency are shown in percent
158
R. K. Vellore et al.