

Knutson et al. 2019a, b). Furthermore, projections of
synoptic-scale TCs, mesoscale convective storms or thunderstorms (e.g., Tyagi et al. 2012), and very short-lived
cloudburst occurrences (Deshpande et al. 2018) into the
future from modeling framework are an ambitiously
demanding task due to stringent model constraints in reproducing their occurrences on localized scale settings.
Notwithstanding these challenges, considerable progress has
been generally realized in the understanding of changes in TC
activity over the global ocean basins (Walsh et al. 2016;
Knutson et al. 2019a, b). The understanding of changes in
regional-scale extreme or convective storm phenomena over
the Indian subcontinent is still rudimentary. In this chapter,
we present an assessment of occurrences and changes in
extreme storm categories suitable for the Indian subcontinent.
8.2 Synoptic-Scale Extreme Storms
TCs are synoptic-scale, warm-core, non-frontal low-pressure
systems embedded in a weakly sheared environment over
tropical warm waters characterized by organized convection
within a closed cyclonic circulation (see Gray 1968; Anthes
1982; IMD 2003). The NIO basin typically contributes about
7–10% of world’s TCs, and these TCs are further considered
to be the most deadly ones in the world (e.g., Mohapatra
et al. 2014; Sahoo and Bhaskaran 2016; Gupta et al. 2018).
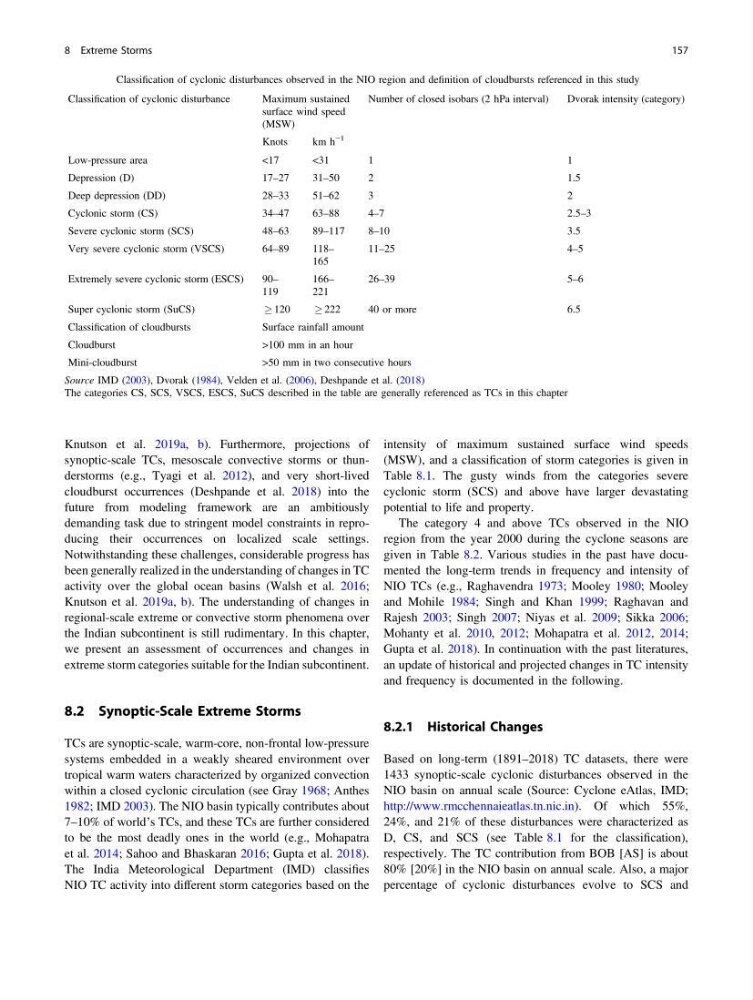
The India Meteorological Department (IMD) classifies
NIO TC activity into different storm categories based on the
intensity of maximum sustained surface wind speeds
(MSW), and a classification of storm categories is given in
Table 8.1. The gusty winds from the categories severe
cyclonic storm (SCS) and above have larger devastating
potential to life and property.
The category 4 and above TCs observed in the NIO
region from the year 2000 during the cyclone seasons are
given in Table 8.2. Various studies in the past have documented the long-term trends in frequency and intensity of
NIO TCs (e.g., Raghavendra 1973; Mooley 1980; Mooley
and Mohile 1984; Singh and Khan 1999; Raghavan and
Rajesh 2003; Singh 2007; Niyas et al. 2009; Sikka 2006;
Mohanty et al. 2010, 2012; Mohapatra et al. 2012, 2014;
Gupta et al. 2018). In continuation with the past literatures,
an update of historical and projected changes in TC intensity
and frequency is documented in the following.
8.2.1 Historical Changes
Based on long-term (1891–2018) TC datasets, there were
1433 synoptic-scale cyclonic disturbances observed in the
NIO basin on annual scale (Source: Cyclone eAtlas, IMD;
http://www.rmcchennaieatlas.tn.nic.in). Of which 55%,
24%, and 21% of these disturbances were characterized as
D, CS, and SCS (see Table 8.1 for the classification),
respectively. The TC contribution from BOB [AS] is about
80% [20%] in the NIO basin on annual scale. Also, a major
percentage of cyclonic disturbances evolve to SCS and
Table 8.1 Classification of cyclonic disturbances observed in the NIO region and definition of cloudbursts referenced in this study
Classification of cyclonic disturbance
Maximum sustained
surface wind speed
(MSW)
Number of closed isobars (2 hPa interval)
Dvorak intensity (category)
Knots
km h
−1
Low-pressure area
<17
<31
1
1
Depression (D)
17–27
31–50
2
1.5
Deep depression (DD)
28–33
51–62
3
2
Cyclonic storm (CS)
34–47
63–88
4–7
2.5–3
Severe cyclonic storm (SCS)
48–63
89–117
8–10
3.5
Very severe cyclonic storm (VSCS)
64–89
118–
165
11–25
4–5
Extremely severe cyclonic storm (ESCS)
90–
119
166–
221
26–39
5–6
Super cyclonic storm (SuCS)
120
222
40 or more
6.5
Classification of cloudbursts
Surface rainfall amount
Cloudburst
>100 mm in an hour
Mini-cloudburst
>50 mm in two consecutive hours
Source IMD (2003), Dvorak (1984), Velden et al. (2006), Deshpande et al. (2018)
The categories CS, SCS, VSCS, ESCS, SuCS described in the table are generally referenced as TCs in this chapter
8 Extreme Storms
157
synoptic-scale TCs, mesoscale convective storms or thunderstorms (e.g., Tyagi et al. 2012), and very short-lived
cloudburst occurrences (Deshpande et al. 2018) into the
future from modeling framework are an ambitiously
demanding task due to stringent model constraints in reproducing their occurrences on localized scale settings.
Notwithstanding these challenges, considerable progress has
been generally realized in the understanding of changes in TC
activity over the global ocean basins (Walsh et al. 2016;
Knutson et al. 2019a, b). The understanding of changes in
regional-scale extreme or convective storm phenomena over
the Indian subcontinent is still rudimentary. In this chapter,
we present an assessment of occurrences and changes in
extreme storm categories suitable for the Indian subcontinent.
8.2 Synoptic-Scale Extreme Storms
TCs are synoptic-scale, warm-core, non-frontal low-pressure
systems embedded in a weakly sheared environment over
tropical warm waters characterized by organized convection
within a closed cyclonic circulation (see Gray 1968; Anthes
1982; IMD 2003). The NIO basin typically contributes about
7–10% of world’s TCs, and these TCs are further considered
to be the most deadly ones in the world (e.g., Mohapatra
et al. 2014; Sahoo and Bhaskaran 2016; Gupta et al. 2018).
The India Meteorological Department (IMD) classifies
NIO TC activity into different storm categories based on the
intensity of maximum sustained surface wind speeds
(MSW), and a classification of storm categories is given in
Table 8.1. The gusty winds from the categories severe
cyclonic storm (SCS) and above have larger devastating
potential to life and property.
The category 4 and above TCs observed in the NIO
region from the year 2000 during the cyclone seasons are
given in Table 8.2. Various studies in the past have documented the long-term trends in frequency and intensity of
NIO TCs (e.g., Raghavendra 1973; Mooley 1980; Mooley
and Mohile 1984; Singh and Khan 1999; Raghavan and
Rajesh 2003; Singh 2007; Niyas et al. 2009; Sikka 2006;
Mohanty et al. 2010, 2012; Mohapatra et al. 2012, 2014;
Gupta et al. 2018). In continuation with the past literatures,
an update of historical and projected changes in TC intensity
and frequency is documented in the following.
8.2.1 Historical Changes
Based on long-term (1891–2018) TC datasets, there were
1433 synoptic-scale cyclonic disturbances observed in the
NIO basin on annual scale (Source: Cyclone eAtlas, IMD;
http://www.rmcchennaieatlas.tn.nic.in). Of which 55%,
24%, and 21% of these disturbances were characterized as
D, CS, and SCS (see Table 8.1 for the classification),
respectively. The TC contribution from BOB [AS] is about
80% [20%] in the NIO basin on annual scale. Also, a major
percentage of cyclonic disturbances evolve to SCS and
Table 8.1 Classification of cyclonic disturbances observed in the NIO region and definition of cloudbursts referenced in this study
Classification of cyclonic disturbance
Maximum sustained
surface wind speed
(MSW)
Number of closed isobars (2 hPa interval)
Dvorak intensity (category)
Knots
km h
−1
Low-pressure area
<17
<31
1
1
Depression (D)
17–27
31–50
2
1.5
Deep depression (DD)
28–33
51–62
3
2
Cyclonic storm (CS)
34–47
63–88
4–7
2.5–3
Severe cyclonic storm (SCS)
48–63
89–117
8–10
3.5
Very severe cyclonic storm (VSCS)
64–89
118–
165
11–25
4–5
Extremely severe cyclonic storm (ESCS)
90–
119
166–
221
26–39
5–6
Super cyclonic storm (SuCS)
120
222
40 or more
6.5
Classification of cloudbursts
Surface rainfall amount
Cloudburst
>100 mm in an hour
Mini-cloudburst
>50 mm in two consecutive hours
Source IMD (2003), Dvorak (1984), Velden et al. (2006), Deshpande et al. (2018)
The categories CS, SCS, VSCS, ESCS, SuCS described in the table are generally referenced as TCs in this chapter
8 Extreme Storms
157