

from 1960s—which is consistent with the analyses from
earlier studies based on the long-term TC datasets (e.g.,
Mandal and Krishna 2009; Mohapatra et al. 2014).
However, a conspicuous rise in the VSCS is evident from
the beginning of the twenty-first century (Fig. 8.4;
Table 8.4). A linear trend analysis shows that the frequency
of VSCS category storms significantly decreased at the rate
of 0.41 per decade on annual scale, and on seasonal scale
0.17 [0.08] per decade during post-monsoon [pre-monsoon]
season. Notably, there is a rising trend in VSCS (+0.59 per
decade) seen in the NIO region during the 2000–2018 period
which is dominated by significant upward trend in
post-monsoon VSCS (+0.86 per decade) in the BOB region.
Based on 1891–2018 period, there were about two VSCS
(and higher intensity storms) occurrences per year in the
NIO region on average—with predominance during the
post-monsoon season.
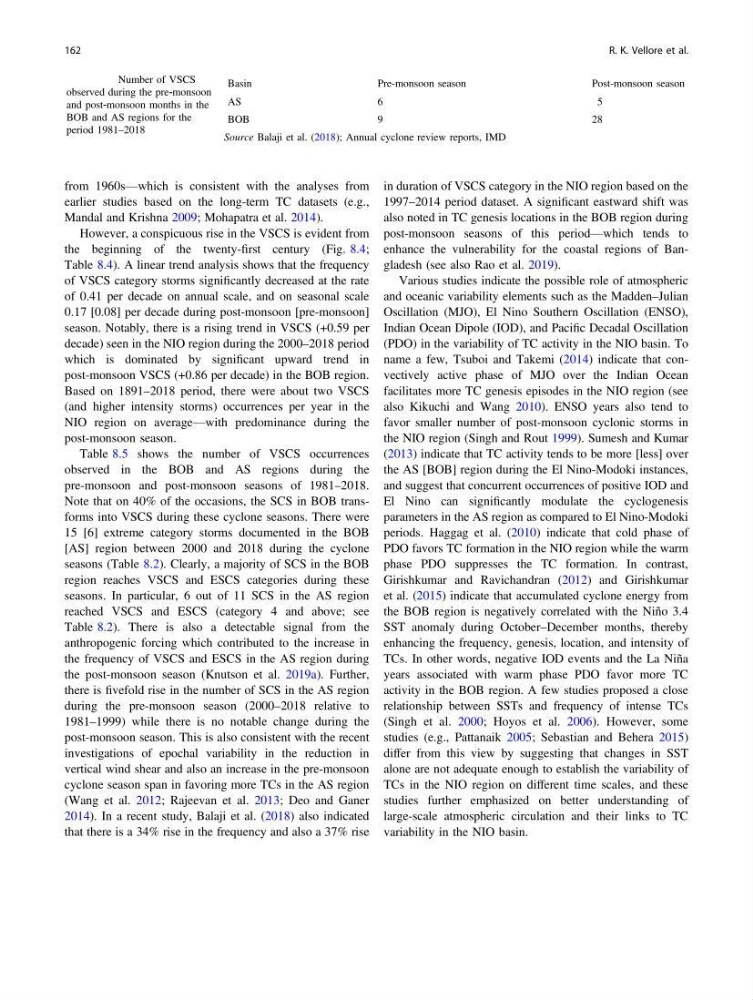
Table 8.5 shows the number of VSCS occurrences
observed in the BOB and AS regions during the
pre-monsoon and post-monsoon seasons of 1981–2018.
Note that on 40% of the occasions, the SCS in BOB transforms into VSCS during these cyclone seasons. There were
15 [6] extreme category storms documented in the BOB
[AS] region between 2000 and 2018 during the cyclone
seasons (Table 8.2). Clearly, a majority of SCS in the BOB
region reaches VSCS and ESCS categories during these
seasons. In particular, 6 out of 11 SCS in the AS region
reached VSCS and ESCS (category 4 and above; see
Table 8.2). There is also a detectable signal from the
anthropogenic forcing which contributed to the increase in
the frequency of VSCS and ESCS in the AS region during
the post-monsoon season (Knutson et al. 2019a). Further,
there is fivefold rise in the number of SCS in the AS region
during the pre-monsoon season (2000–2018 relative to
1981–1999) while there is no notable change during the
post-monsoon season. This is also consistent with the recent
investigations of epochal variability in the reduction in
vertical wind shear and also an increase in the pre-monsoon
cyclone season span in favoring more TCs in the AS region
(Wang et al. 2012; Rajeevan et al. 2013; Deo and Ganer
2014). In a recent study, Balaji et al. (2018) also indicated
that there is a 34% rise in the frequency and also a 37% rise
in duration of VSCS category in the NIO region based on the
1997–2014 period dataset. A significant eastward shift was
also noted in TC genesis locations in the BOB region during
post-monsoon seasons of this period—which tends to
enhance the vulnerability for the coastal regions of Bangladesh (see also Rao et al. 2019).
Various studies indicate the possible role of atmospheric
and oceanic variability elements such as the Madden–Julian
Oscillation (MJO), El Nino Southern Oscillation (ENSO),
Indian Ocean Dipole (IOD), and Pacific Decadal Oscillation
(PDO) in the variability of TC activity in the NIO basin. To
name a few, Tsuboi and Takemi (2014) indicate that convectively active phase of MJO over the Indian Ocean
facilitates more TC genesis episodes in the NIO region (see
also Kikuchi and Wang 2010). ENSO years also tend to
favor smaller number of post-monsoon cyclonic storms in
the NIO region (Singh and Rout 1999). Sumesh and Kumar
(2013) indicate that TC activity tends to be more [less] over
the AS [BOB] region during the El Nino-Modoki instances,
and suggest that concurrent occurrences of positive IOD and
El Nino can significantly modulate the cyclogenesis
parameters in the AS region as compared to El Nino-Modoki
periods. Haggag et al. (2010) indicate that cold phase of
PDO favors TC formation in the NIO region while the warm
phase PDO suppresses the TC formation. In contrast,
Girishkumar and Ravichandran (2012) and Girishkumar
et al. (2015) indicate that accumulated cyclone energy from
the BOB region is negatively correlated with the Niño 3.4
SST anomaly during October–December months, thereby
enhancing the frequency, genesis, location, and intensity of
TCs. In other words, negative IOD events and the La Niña
years associated with warm phase PDO favor more TC
activity in the BOB region. A few studies proposed a close
relationship between SSTs and frequency of intense TCs
(Singh et al. 2000; Hoyos et al. 2006). However, some
studies (e.g., Pattanaik 2005; Sebastian and Behera 2015)
differ from this view by suggesting that changes in SST
alone are not adequate enough to establish the variability of
TCs in the NIO region on different time scales, and these
studies further emphasized on better understanding of
large-scale atmospheric circulation and their links to TC
variability in the NIO basin.
Table 8.5 Number of VSCS
observed during the pre‐monsoon
and post‐monsoon months in the
BOB and AS regions for the
period 1981–2018
Basin
Pre-monsoon season
Post-monsoon season
AS
6
5
BOB
9
28
Source Balaji et al. (2018); Annual cyclone review reports, IMD
162
R. K. Vellore et al.
earlier studies based on the long-term TC datasets (e.g.,
Mandal and Krishna 2009; Mohapatra et al. 2014).
However, a conspicuous rise in the VSCS is evident from
the beginning of the twenty-first century (Fig. 8.4;
Table 8.4). A linear trend analysis shows that the frequency
of VSCS category storms significantly decreased at the rate
of 0.41 per decade on annual scale, and on seasonal scale
0.17 [0.08] per decade during post-monsoon [pre-monsoon]
season. Notably, there is a rising trend in VSCS (+0.59 per
decade) seen in the NIO region during the 2000–2018 period
which is dominated by significant upward trend in
post-monsoon VSCS (+0.86 per decade) in the BOB region.
Based on 1891–2018 period, there were about two VSCS
(and higher intensity storms) occurrences per year in the
NIO region on average—with predominance during the
post-monsoon season.
Table 8.5 shows the number of VSCS occurrences
observed in the BOB and AS regions during the
pre-monsoon and post-monsoon seasons of 1981–2018.
Note that on 40% of the occasions, the SCS in BOB transforms into VSCS during these cyclone seasons. There were
15 [6] extreme category storms documented in the BOB
[AS] region between 2000 and 2018 during the cyclone
seasons (Table 8.2). Clearly, a majority of SCS in the BOB
region reaches VSCS and ESCS categories during these
seasons. In particular, 6 out of 11 SCS in the AS region
reached VSCS and ESCS (category 4 and above; see
Table 8.2). There is also a detectable signal from the
anthropogenic forcing which contributed to the increase in
the frequency of VSCS and ESCS in the AS region during
the post-monsoon season (Knutson et al. 2019a). Further,
there is fivefold rise in the number of SCS in the AS region
during the pre-monsoon season (2000–2018 relative to
1981–1999) while there is no notable change during the
post-monsoon season. This is also consistent with the recent
investigations of epochal variability in the reduction in
vertical wind shear and also an increase in the pre-monsoon
cyclone season span in favoring more TCs in the AS region
(Wang et al. 2012; Rajeevan et al. 2013; Deo and Ganer
2014). In a recent study, Balaji et al. (2018) also indicated
that there is a 34% rise in the frequency and also a 37% rise
in duration of VSCS category in the NIO region based on the
1997–2014 period dataset. A significant eastward shift was
also noted in TC genesis locations in the BOB region during
post-monsoon seasons of this period—which tends to
enhance the vulnerability for the coastal regions of Bangladesh (see also Rao et al. 2019).
Various studies indicate the possible role of atmospheric
and oceanic variability elements such as the Madden–Julian
Oscillation (MJO), El Nino Southern Oscillation (ENSO),
Indian Ocean Dipole (IOD), and Pacific Decadal Oscillation
(PDO) in the variability of TC activity in the NIO basin. To
name a few, Tsuboi and Takemi (2014) indicate that convectively active phase of MJO over the Indian Ocean
facilitates more TC genesis episodes in the NIO region (see
also Kikuchi and Wang 2010). ENSO years also tend to
favor smaller number of post-monsoon cyclonic storms in
the NIO region (Singh and Rout 1999). Sumesh and Kumar
(2013) indicate that TC activity tends to be more [less] over
the AS [BOB] region during the El Nino-Modoki instances,
and suggest that concurrent occurrences of positive IOD and
El Nino can significantly modulate the cyclogenesis
parameters in the AS region as compared to El Nino-Modoki
periods. Haggag et al. (2010) indicate that cold phase of
PDO favors TC formation in the NIO region while the warm
phase PDO suppresses the TC formation. In contrast,
Girishkumar and Ravichandran (2012) and Girishkumar
et al. (2015) indicate that accumulated cyclone energy from
the BOB region is negatively correlated with the Niño 3.4
SST anomaly during October–December months, thereby
enhancing the frequency, genesis, location, and intensity of
TCs. In other words, negative IOD events and the La Niña
years associated with warm phase PDO favor more TC
activity in the BOB region. A few studies proposed a close
relationship between SSTs and frequency of intense TCs
(Singh et al. 2000; Hoyos et al. 2006). However, some
studies (e.g., Pattanaik 2005; Sebastian and Behera 2015)
differ from this view by suggesting that changes in SST
alone are not adequate enough to establish the variability of
TCs in the NIO region on different time scales, and these
studies further emphasized on better understanding of
large-scale atmospheric circulation and their links to TC
variability in the NIO basin.
Table 8.5 Number of VSCS
observed during the pre‐monsoon
and post‐monsoon months in the
BOB and AS regions for the
period 1981–2018
Basin
Pre-monsoon season
Post-monsoon season
AS
6
5
BOB
9
28
Source Balaji et al. (2018); Annual cyclone review reports, IMD
162
R. K. Vellore et al.