

4.2 Second-Order Circuits
145
Fig. 4.12 Phase portrait and time evolution of state variables for a relaxation oscillator obtained
by inserting a parasitic inductance L p in the circuit with impasse points of Fig. 4.3. Simulations
are shown for three different values of L p , namely, L p = 1 (upper plot), L p = 0.1 (middle plot),
and L p = 10 −3 (lower plot)
145
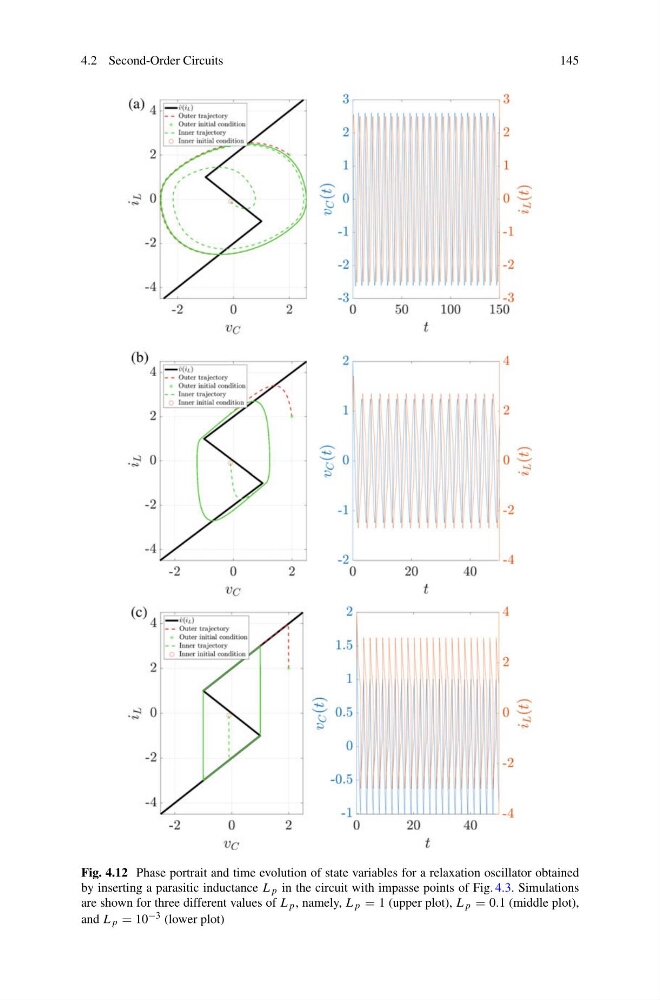
Fig. 4.12 Phase portrait and time evolution of state variables for a relaxation oscillator obtained
by inserting a parasitic inductance L p in the circuit with impasse points of Fig. 4.3. Simulations
are shown for three different values of L p , namely, L p = 1 (upper plot), L p = 0.1 (middle plot),
and L p = 10 −3 (lower plot)