

Comparison of Comfort Performance Criteria and Sensing Approach …
383
Table 1 Frequency hours of shading and lighting activation according to the lower and upper
illuminance thresholds
Condition
E min (lx) E max (lx) Artificial
lighting (%)
Shading (%) Total no.
activation hours
(%)
Normal
300
1000
22.86
49.94
27.20
Younger
occupants a
400
650
27.92
61.54
10.54
Older
occupants b
354
1180
25.70
46.08
28.22
Glasses worn
occupants a
265
600
21.42
63.36
15.22
a Average value for a neutral condition obtained from a qualitative survey performed at Politecnico
di Milano (18–22-year-old students)
b Assumed value, considering the ~18% decay of stimulus at the 550 nm wavelength of light (see
Turner and Mainster 2008)
floor. The optical properties of the materials were the following: glass τ vis = 0.65;
ceiling ρ vis = 0.8; internal walls ρ vis = 0.5; and floor ρ vis = 0.4.
The obtained values for different criteria were confronted against the traditional
E h evaluation; that is, what was found from analyzing preferences of a qualitative
survey applied to bachelor students and what has been suggested by Turner and
Mainster (2008) due to the eyesight decay. The frequency of activation and the
variances obtained due to these values have been collected and presented in Table 1,
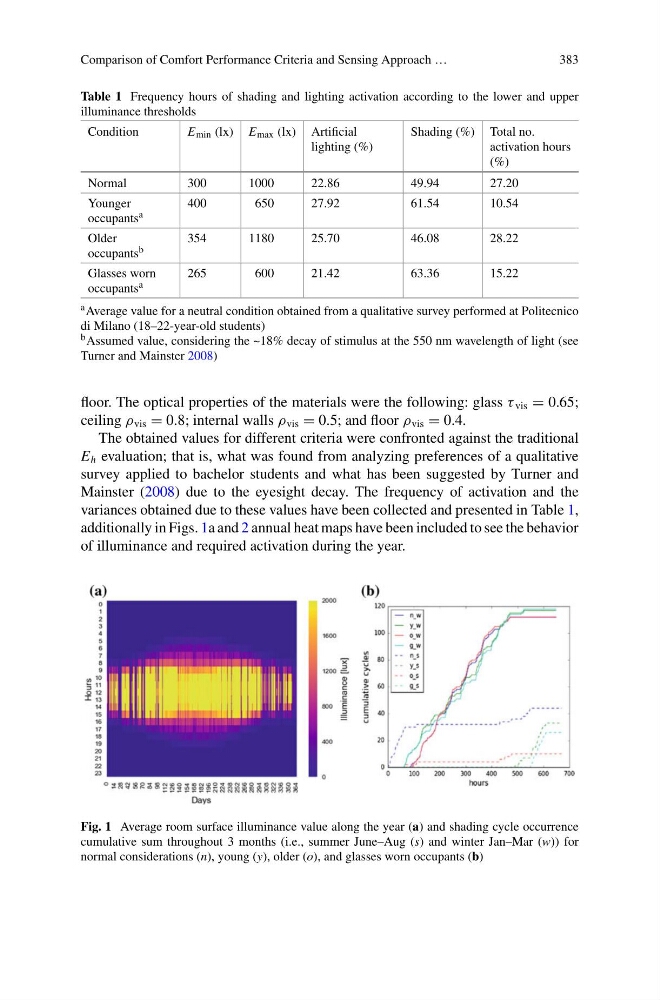
additionally in Figs. 1a and 2 annual heat maps have been included to see the behavior
of illuminance and required activation during the year.
Fig. 1 Average room surface illuminance value along the year (a) and shading cycle occurrence
cumulative sum throughout 3 months (i.e., summer June–Aug (s) and winter Jan–Mar (w)) for
normal considerations (n), young (y), older (o), and glasses worn occupants (b)
383
Table 1 Frequency hours of shading and lighting activation according to the lower and upper
illuminance thresholds
Condition
E min (lx) E max (lx) Artificial
lighting (%)
Shading (%) Total no.
activation hours
(%)
Normal
300
1000
22.86
49.94
27.20
Younger
occupants a
400
650
27.92
61.54
10.54
Older
occupants b
354
1180
25.70
46.08
28.22
Glasses worn
occupants a
265
600
21.42
63.36
15.22
a Average value for a neutral condition obtained from a qualitative survey performed at Politecnico
di Milano (18–22-year-old students)
b Assumed value, considering the ~18% decay of stimulus at the 550 nm wavelength of light (see
Turner and Mainster 2008)
floor. The optical properties of the materials were the following: glass τ vis = 0.65;
ceiling ρ vis = 0.8; internal walls ρ vis = 0.5; and floor ρ vis = 0.4.
The obtained values for different criteria were confronted against the traditional
E h evaluation; that is, what was found from analyzing preferences of a qualitative
survey applied to bachelor students and what has been suggested by Turner and
Mainster (2008) due to the eyesight decay. The frequency of activation and the
variances obtained due to these values have been collected and presented in Table 1,
additionally in Figs. 1a and 2 annual heat maps have been included to see the behavior
of illuminance and required activation during the year.
Fig. 1 Average room surface illuminance value along the year (a) and shading cycle occurrence
cumulative sum throughout 3 months (i.e., summer June–Aug (s) and winter Jan–Mar (w)) for
normal considerations (n), young (y), older (o), and glasses worn occupants (b)