

378
M. Fiori et al.
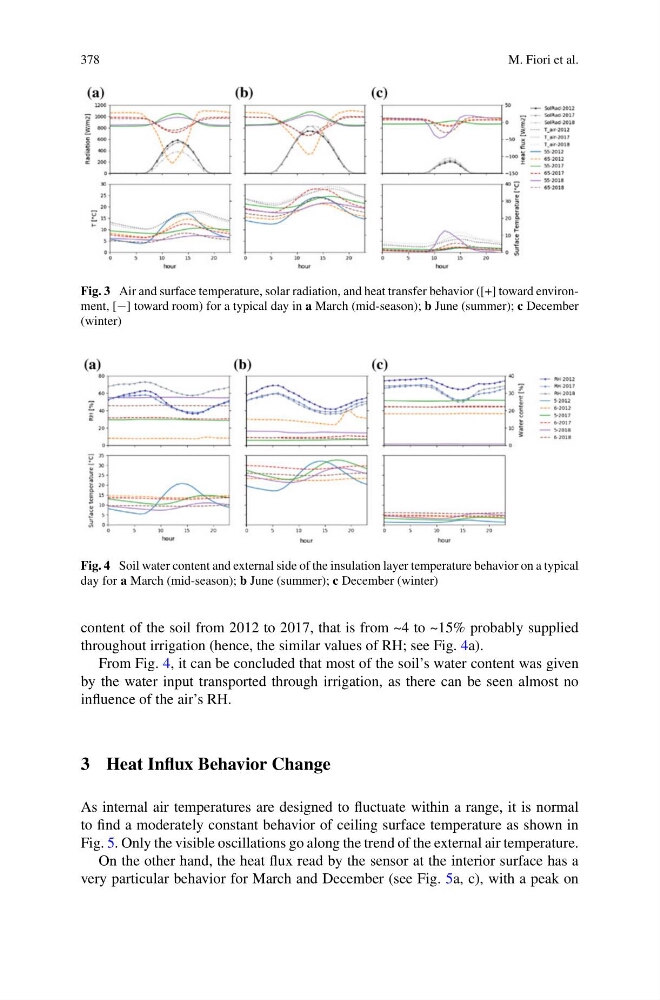
Fig. 3 Air and surface temperature, solar radiation, and heat transfer behavior ([+] toward environment, [−] toward room) for a typical day in a March (mid-season); b June (summer); c December
(winter)
Fig. 4 Soil water content and external side of the insulation layer temperature behavior on a typical
day for a March (mid-season); b June (summer); c December (winter)
content of the soil from 2012 to 2017, that is from ~4 to ~15% probably supplied
throughout irrigation (hence, the similar values of RH; see Fig. 4a).
From Fig. 4, it can be concluded that most of the soil’s water content was given
by the water input transported through irrigation, as there can be seen almost no
influence of the air’s RH.
3 Heat Influx Behavior Change
As internal air temperatures are designed to fluctuate within a range, it is normal
to find a moderately constant behavior of ceiling surface temperature as shown in
Fig. 5. Only the visible oscillations go along the trend of the external air temperature.
On the other hand, the heat flux read by the sensor at the interior surface has a
very particular behavior for March and December (see Fig. 5a, c), with a peak on
M. Fiori et al.
Fig. 3 Air and surface temperature, solar radiation, and heat transfer behavior ([+] toward environment, [−] toward room) for a typical day in a March (mid-season); b June (summer); c December
(winter)
Fig. 4 Soil water content and external side of the insulation layer temperature behavior on a typical
day for a March (mid-season); b June (summer); c December (winter)
content of the soil from 2012 to 2017, that is from ~4 to ~15% probably supplied
throughout irrigation (hence, the similar values of RH; see Fig. 4a).
From Fig. 4, it can be concluded that most of the soil’s water content was given
by the water input transported through irrigation, as there can be seen almost no
influence of the air’s RH.
3 Heat Influx Behavior Change
As internal air temperatures are designed to fluctuate within a range, it is normal
to find a moderately constant behavior of ceiling surface temperature as shown in
Fig. 5. Only the visible oscillations go along the trend of the external air temperature.
On the other hand, the heat flux read by the sensor at the interior surface has a
very particular behavior for March and December (see Fig. 5a, c), with a peak on