

Assessing Water Demand of Green Roofs Under Variants of Climate …
377
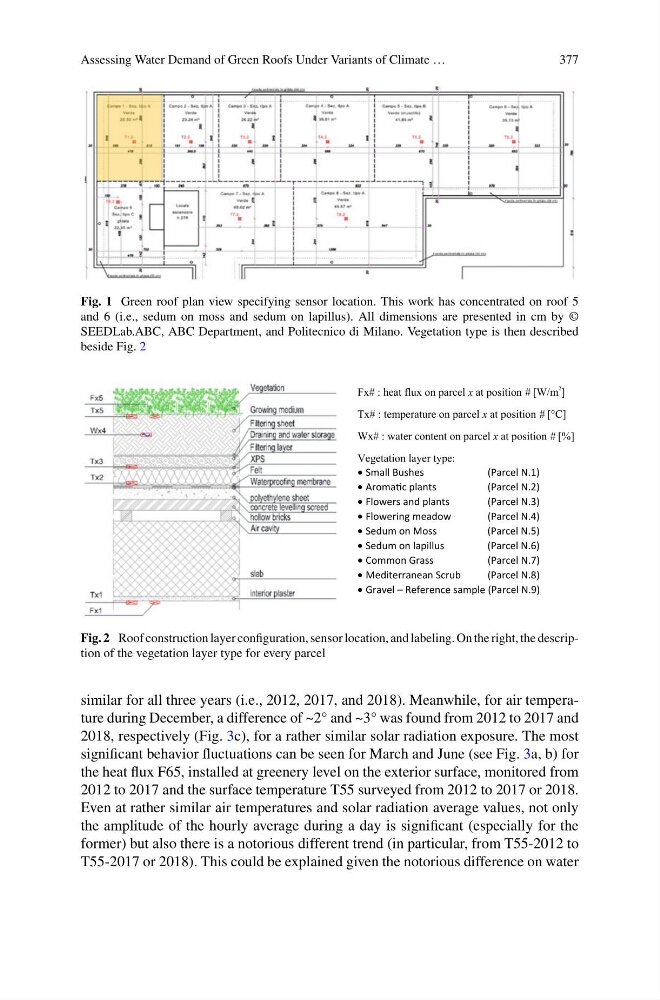
Fig. 1 Green roof plan view specifying sensor location. This work has concentrated on roof 5
and 6 (i.e., sedum on moss and sedum on lapillus). All dimensions are presented in cm by ©
SEEDLab.ABC, ABC Department, and Politecnico di Milano. Vegetation type is then described
beside Fig. 2
Fx# : heat flux on parcel x at position # [W/m
2 ]
Tx# : temperature on parcel x at position # [°C]
Wx# : water content on parcel x at position # [%]
Vegetation layer type:
• Small Bushes
(Parcel N.1)
• AromaƟc plants
(Parcel N.2)
• Flowers and plants
(Parcel N.3)
• Flowering meadow
(Parcel N.4)
• Sedum on Moss
(Parcel N.5)
• Sedum on lapillus
(Parcel N.6)
• Common Grass
(Parcel N.7)
• Mediterranean Scrub
(Parcel N.8)
• Gravel – Reference sample (Parcel N.9)
Fig. 2 Roof construction layer configuration, sensor location, and labeling. On the right, the description of the vegetation layer type for every parcel
similar for all three years (i.e., 2012, 2017, and 2018). Meanwhile, for air temperature during December, a difference of ~2° and ~3° was found from 2012 to 2017 and
2018, respectively (Fig. 3c), for a rather similar solar radiation exposure. The most
significant behavior fluctuations can be seen for March and June (see Fig. 3a, b) for
the heat flux F65, installed at greenery level on the exterior surface, monitored from
2012 to 2017 and the surface temperature T55 surveyed from 2012 to 2017 or 2018.
Even at rather similar air temperatures and solar radiation average values, not only
the amplitude of the hourly average during a day is significant (especially for the
former) but also there is a notorious different trend (in particular, from T55-2012 to
T55-2017 or 2018). This could be explained given the notorious difference on water
377
Fig. 1 Green roof plan view specifying sensor location. This work has concentrated on roof 5
and 6 (i.e., sedum on moss and sedum on lapillus). All dimensions are presented in cm by ©
SEEDLab.ABC, ABC Department, and Politecnico di Milano. Vegetation type is then described
beside Fig. 2
Fx# : heat flux on parcel x at position # [W/m
2 ]
Tx# : temperature on parcel x at position # [°C]
Wx# : water content on parcel x at position # [%]
Vegetation layer type:
• Small Bushes
(Parcel N.1)
• AromaƟc plants
(Parcel N.2)
• Flowers and plants
(Parcel N.3)
• Flowering meadow
(Parcel N.4)
• Sedum on Moss
(Parcel N.5)
• Sedum on lapillus
(Parcel N.6)
• Common Grass
(Parcel N.7)
• Mediterranean Scrub
(Parcel N.8)
• Gravel – Reference sample (Parcel N.9)
Fig. 2 Roof construction layer configuration, sensor location, and labeling. On the right, the description of the vegetation layer type for every parcel
similar for all three years (i.e., 2012, 2017, and 2018). Meanwhile, for air temperature during December, a difference of ~2° and ~3° was found from 2012 to 2017 and
2018, respectively (Fig. 3c), for a rather similar solar radiation exposure. The most
significant behavior fluctuations can be seen for March and June (see Fig. 3a, b) for
the heat flux F65, installed at greenery level on the exterior surface, monitored from
2012 to 2017 and the surface temperature T55 surveyed from 2012 to 2017 or 2018.
Even at rather similar air temperatures and solar radiation average values, not only
the amplitude of the hourly average during a day is significant (especially for the
former) but also there is a notorious different trend (in particular, from T55-2012 to
T55-2017 or 2018). This could be explained given the notorious difference on water