

84
4 Motion of Microorganisms
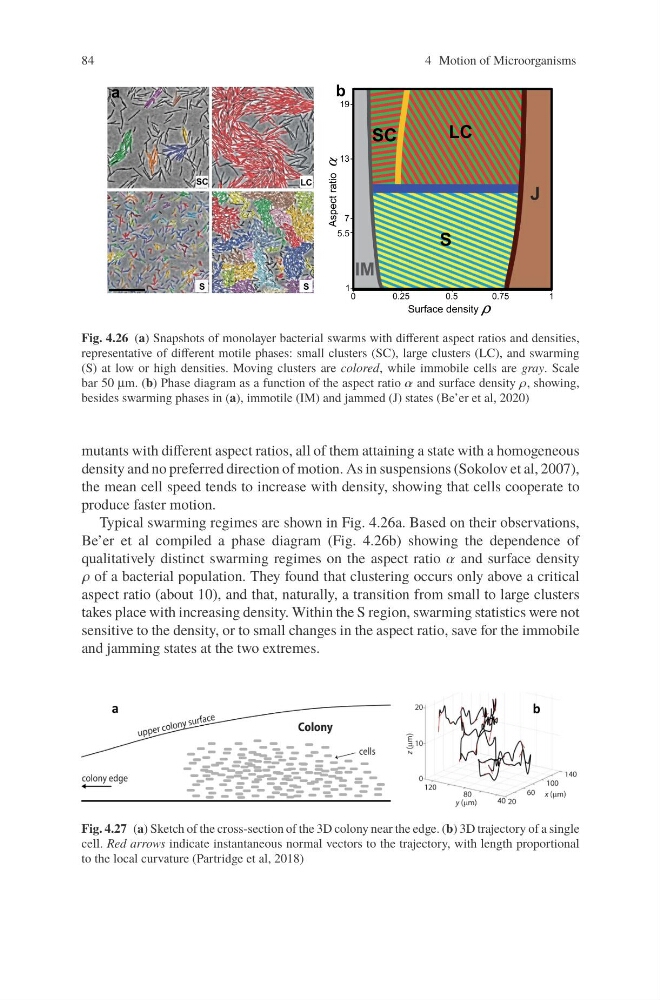
Fig. 4.26 (a) Snapshots of monolayer bacterial swarms with different aspect ratios and densities,
representative of different motile phases: small clusters (SC), large clusters (LC), and swarming
(S) at low or high densities. Moving clusters are colored, while immobile cells are gray. Scale
bar 50 μm. (b) Phase diagram as a function of the aspect ratio α and surface density ρ, showing,
besides swarming phases in (a), immotile (IM) and jammed (J) states (Be’er et al, 2020)
mutants with different aspect ratios, all of them attaining a state with a homogeneous
density and no preferred direction of motion. As in suspensions (Sokolov et al, 2007),
the mean cell speed tends to increase with density, showing that cells cooperate to
produce faster motion.
Typical swarming regimes are shown in Fig. 4.26a. Based on their observations,
Be’er et al compiled a phase diagram (Fig. 4.26b) showing the dependence of
qualitatively distinct swarming regimes on the aspect ratio α and surface density
ρ of a bacterial population. They found that clustering occurs only above a critical
aspect ratio (about 10), and that, naturally, a transition from small to large clusters
takes place with increasing density. Within the S region, swarming statistics were not
sensitive to the density, or to small changes in the aspect ratio, save for the immobile
and jamming states at the two extremes.
Fig. 4.27 (a) Sketch of the cross-section of the 3D colony near the edge. (b) 3D trajectory of a single
cell. Red arrows indicate instantaneous normal vectors to the trajectory, with length proportional
to the local curvature (Partridge et al, 2018)
4 Motion of Microorganisms
Fig. 4.26 (a) Snapshots of monolayer bacterial swarms with different aspect ratios and densities,
representative of different motile phases: small clusters (SC), large clusters (LC), and swarming
(S) at low or high densities. Moving clusters are colored, while immobile cells are gray. Scale
bar 50 μm. (b) Phase diagram as a function of the aspect ratio α and surface density ρ, showing,
besides swarming phases in (a), immotile (IM) and jammed (J) states (Be’er et al, 2020)
mutants with different aspect ratios, all of them attaining a state with a homogeneous
density and no preferred direction of motion. As in suspensions (Sokolov et al, 2007),
the mean cell speed tends to increase with density, showing that cells cooperate to
produce faster motion.
Typical swarming regimes are shown in Fig. 4.26a. Based on their observations,
Be’er et al compiled a phase diagram (Fig. 4.26b) showing the dependence of
qualitatively distinct swarming regimes on the aspect ratio α and surface density
ρ of a bacterial population. They found that clustering occurs only above a critical
aspect ratio (about 10), and that, naturally, a transition from small to large clusters
takes place with increasing density. Within the S region, swarming statistics were not
sensitive to the density, or to small changes in the aspect ratio, save for the immobile
and jamming states at the two extremes.
Fig. 4.27 (a) Sketch of the cross-section of the 3D colony near the edge. (b) 3D trajectory of a single
cell. Red arrows indicate instantaneous normal vectors to the trajectory, with length proportional
to the local curvature (Partridge et al, 2018)