

4.5 Bacterial Circus Arena
79
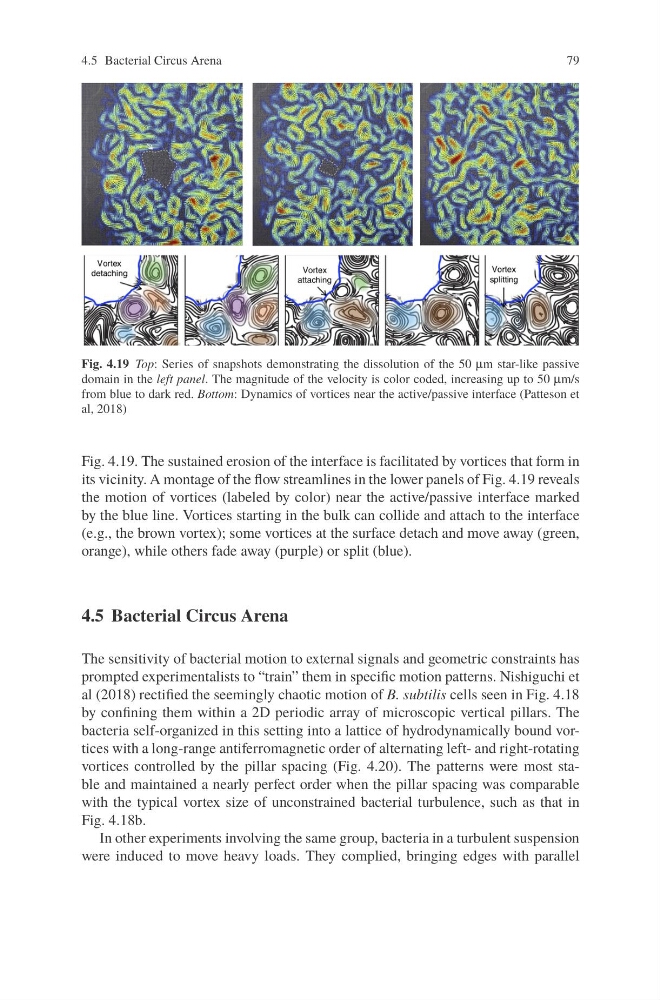
Fig. 4.19 Top: Series of snapshots demonstrating the dissolution of the 50 μm star-like passive
domain in the left panel. The magnitude of the velocity is color coded, increasing up to 50 μm/s
from blue to dark red. Bottom: Dynamics of vortices near the active/passive interface (Patteson et
al, 2018)
Fig. 4.19. The sustained erosion of the interface is facilitated by vortices that form in
its vicinity. A montage of the flow streamlines in the lower panels of Fig. 4.19 reveals
the motion of vortices (labeled by color) near the active/passive interface marked
by the blue line. Vortices starting in the bulk can collide and attach to the interface
(e.g., the brown vortex); some vortices at the surface detach and move away (green,
orange), while others fade away (purple) or split (blue).
4.5 Bacterial Circus Arena
The sensitivity of bacterial motion to external signals and geometric constraints has
prompted experimentalists to “train” them in specific motion patterns. Nishiguchi et
al (2018) rectified the seemingly chaotic motion of B. subtilis cells seen in Fig. 4.18
by confining them within a 2D periodic array of microscopic vertical pillars. The
bacteria self-organized in this setting into a lattice of hydrodynamically bound vortices with a long-range antiferromagnetic order of alternating left- and right-rotating
vortices controlled by the pillar spacing (Fig. 4.20). The patterns were most stable and maintained a nearly perfect order when the pillar spacing was comparable
with the typical vortex size of unconstrained bacterial turbulence, such as that in
Fig. 4.18b.
In other experiments involving the same group, bacteria in a turbulent suspension
were induced to move heavy loads. They complied, bringing edges with parallel
79
Fig. 4.19 Top: Series of snapshots demonstrating the dissolution of the 50 μm star-like passive
domain in the left panel. The magnitude of the velocity is color coded, increasing up to 50 μm/s
from blue to dark red. Bottom: Dynamics of vortices near the active/passive interface (Patteson et
al, 2018)
Fig. 4.19. The sustained erosion of the interface is facilitated by vortices that form in
its vicinity. A montage of the flow streamlines in the lower panels of Fig. 4.19 reveals
the motion of vortices (labeled by color) near the active/passive interface marked
by the blue line. Vortices starting in the bulk can collide and attach to the interface
(e.g., the brown vortex); some vortices at the surface detach and move away (green,
orange), while others fade away (purple) or split (blue).
4.5 Bacterial Circus Arena
The sensitivity of bacterial motion to external signals and geometric constraints has
prompted experimentalists to “train” them in specific motion patterns. Nishiguchi et
al (2018) rectified the seemingly chaotic motion of B. subtilis cells seen in Fig. 4.18
by confining them within a 2D periodic array of microscopic vertical pillars. The
bacteria self-organized in this setting into a lattice of hydrodynamically bound vortices with a long-range antiferromagnetic order of alternating left- and right-rotating
vortices controlled by the pillar spacing (Fig. 4.20). The patterns were most stable and maintained a nearly perfect order when the pillar spacing was comparable
with the typical vortex size of unconstrained bacterial turbulence, such as that in
Fig. 4.18b.
In other experiments involving the same group, bacteria in a turbulent suspension
were induced to move heavy loads. They complied, bringing edges with parallel