

80
4 Motion of Microorganisms
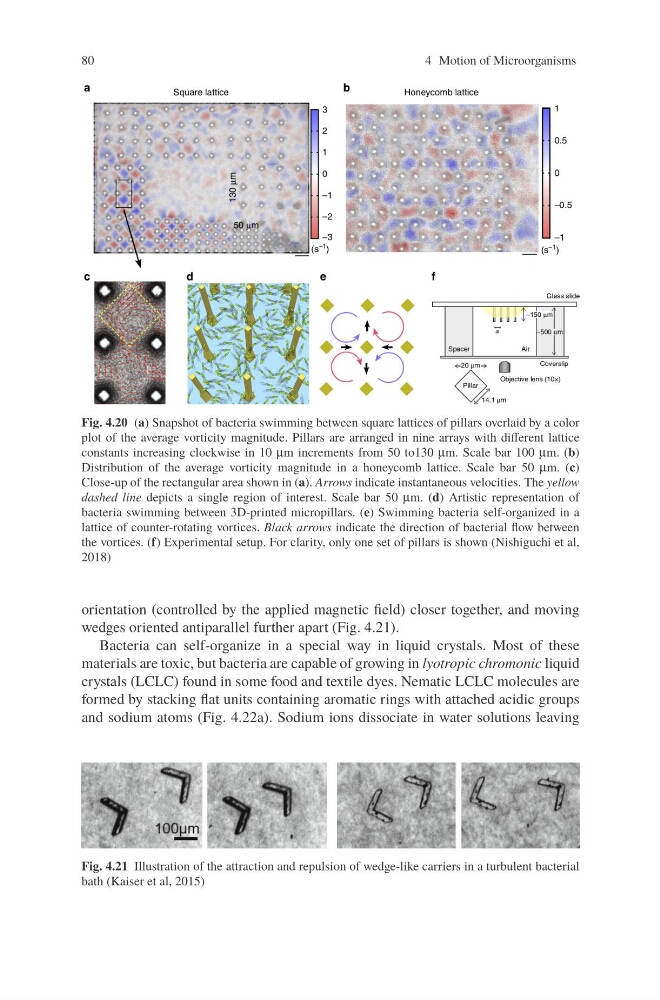
Fig. 4.20 (a) Snapshot of bacteria swimming between square lattices of pillars overlaid by a color
plot of the average vorticity magnitude. Pillars are arranged in nine arrays with different lattice
constants increasing clockwise in 10 μm increments from 50 to130 μm. Scale bar 100 μm. (b)
Distribution of the average vorticity magnitude in a honeycomb lattice. Scale bar 50 μm. (c)
Close-up of the rectangular area shown in (a). Arrows indicate instantaneous velocities. The yellow
dashed line depicts a single region of interest. Scale bar 50 μm. (d) Artistic representation of
bacteria swimming between 3D-printed micropillars. (e) Swimming bacteria self-organized in a
lattice of counter-rotating vortices. Black arrows indicate the direction of bacterial flow between
the vortices. (f) Experimental setup. For clarity, only one set of pillars is shown (Nishiguchi et al,
2018)
orientation (controlled by the applied magnetic field) closer together, and moving
wedges oriented antiparallel further apart (Fig. 4.21).
Bacteria can self-organize in a special way in liquid crystals. Most of these
materials are toxic, but bacteria are capable of growing in lyotropic chromonic liquid
crystals (LCLC) found in some food and textile dyes. Nematic LCLC molecules are
formed by stacking flat units containing aromatic rings with attached acidic groups
and sodium atoms (Fig. 4.22a). Sodium ions dissociate in water solutions leaving
Fig. 4.21 Illustration of the attraction and repulsion of wedge-like carriers in a turbulent bacterial
bath (Kaiser et al, 2015)
4 Motion of Microorganisms
Fig. 4.20 (a) Snapshot of bacteria swimming between square lattices of pillars overlaid by a color
plot of the average vorticity magnitude. Pillars are arranged in nine arrays with different lattice
constants increasing clockwise in 10 μm increments from 50 to130 μm. Scale bar 100 μm. (b)
Distribution of the average vorticity magnitude in a honeycomb lattice. Scale bar 50 μm. (c)
Close-up of the rectangular area shown in (a). Arrows indicate instantaneous velocities. The yellow
dashed line depicts a single region of interest. Scale bar 50 μm. (d) Artistic representation of
bacteria swimming between 3D-printed micropillars. (e) Swimming bacteria self-organized in a
lattice of counter-rotating vortices. Black arrows indicate the direction of bacterial flow between
the vortices. (f) Experimental setup. For clarity, only one set of pillars is shown (Nishiguchi et al,
2018)
orientation (controlled by the applied magnetic field) closer together, and moving
wedges oriented antiparallel further apart (Fig. 4.21).
Bacteria can self-organize in a special way in liquid crystals. Most of these
materials are toxic, but bacteria are capable of growing in lyotropic chromonic liquid
crystals (LCLC) found in some food and textile dyes. Nematic LCLC molecules are
formed by stacking flat units containing aromatic rings with attached acidic groups
and sodium atoms (Fig. 4.22a). Sodium ions dissociate in water solutions leaving
Fig. 4.21 Illustration of the attraction and repulsion of wedge-like carriers in a turbulent bacterial
bath (Kaiser et al, 2015)