

60
3 Active Colloids
3.7 Active Suspensions
Interactions between colloidal swimmers carried by the induced flow turn their assembly into a correlated flock and convert the entire system into an active medium. It
can be described on a continuum level by effective mass transport and hydrodynamic
equations (Jülicher and Prost, 2009), leading eventually to the simulations of the dynamics of active fluids described in Sects. 2.5 and 2.7. The next level is a statistical
description taking into account fluctuations of colloidal particles (Romanczuk et al,
2012). Long-range hydrodynamic interactions make theoretical description of dense
suspensions and emulsions very difficult, even in the absence of activity. Passive
suspensions are treated as a fluctuating continuous medium (Batchelor, 1976), in the
spirit of one of the annus mirabilis papers by Einstein (1905). The theory of active
suspensions and emulsions may look unassailable when we recall that short-range
interactions make even “dancing” movements of paired active swimmers so elaborate and variegated, as we have seen in Sect. 3.3, but a statistical description abstracts
from such intricate details.
Experiments (as well as simulations) of active suspensions are commonly carried
out in 2D, either in a shallow cuvette or allowing heavy particles to settle on the
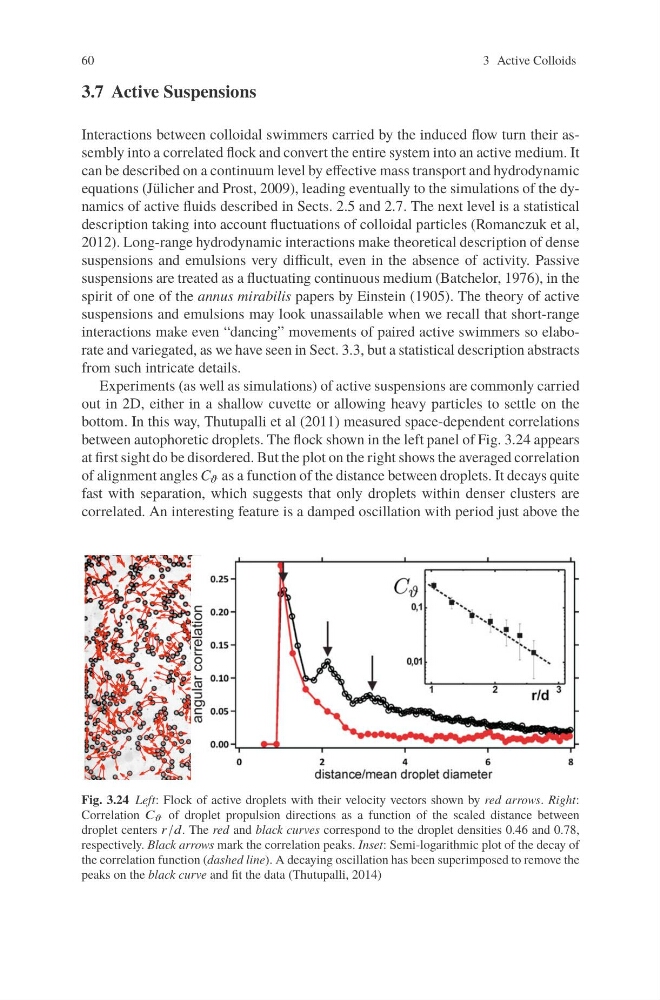
bottom. In this way, Thutupalli et al (2011) measured space-dependent correlations
between autophoretic droplets. The flock shown in the left panel of Fig. 3.24 appears
at first sight do be disordered. But the plot on the right shows the averaged correlation
of alignment angles C ϑ as a function of the distance between droplets. It decays quite
fast with separation, which suggests that only droplets within denser clusters are
correlated. An interesting feature is a damped oscillation with period just above the
Fig. 3.24 Left: Flock of active droplets with their velocity vectors shown by red arrows. Right:
Correlation C ϑ of droplet propulsion directions as a function of the scaled distance between
droplet centers r/d. The red and black curves correspond to the droplet densities 0.46 and 0.78,
respectively. Black arrows mark the correlation peaks. Inset: Semi-logarithmic plot of the decay of
the correlation function (dashed line). A decaying oscillation has been superimposed to remove the
peaks on the black curve and fit the data (Thutupalli, 2014)
3 Active Colloids
3.7 Active Suspensions
Interactions between colloidal swimmers carried by the induced flow turn their assembly into a correlated flock and convert the entire system into an active medium. It
can be described on a continuum level by effective mass transport and hydrodynamic
equations (Jülicher and Prost, 2009), leading eventually to the simulations of the dynamics of active fluids described in Sects. 2.5 and 2.7. The next level is a statistical
description taking into account fluctuations of colloidal particles (Romanczuk et al,
2012). Long-range hydrodynamic interactions make theoretical description of dense
suspensions and emulsions very difficult, even in the absence of activity. Passive
suspensions are treated as a fluctuating continuous medium (Batchelor, 1976), in the
spirit of one of the annus mirabilis papers by Einstein (1905). The theory of active
suspensions and emulsions may look unassailable when we recall that short-range
interactions make even “dancing” movements of paired active swimmers so elaborate and variegated, as we have seen in Sect. 3.3, but a statistical description abstracts
from such intricate details.
Experiments (as well as simulations) of active suspensions are commonly carried
out in 2D, either in a shallow cuvette or allowing heavy particles to settle on the
bottom. In this way, Thutupalli et al (2011) measured space-dependent correlations
between autophoretic droplets. The flock shown in the left panel of Fig. 3.24 appears
at first sight do be disordered. But the plot on the right shows the averaged correlation
of alignment angles C ϑ as a function of the distance between droplets. It decays quite
fast with separation, which suggests that only droplets within denser clusters are
correlated. An interesting feature is a damped oscillation with period just above the
Fig. 3.24 Left: Flock of active droplets with their velocity vectors shown by red arrows. Right:
Correlation C ϑ of droplet propulsion directions as a function of the scaled distance between
droplet centers r/d. The red and black curves correspond to the droplet densities 0.46 and 0.78,
respectively. Black arrows mark the correlation peaks. Inset: Semi-logarithmic plot of the decay of
the correlation function (dashed line). A decaying oscillation has been superimposed to remove the
peaks on the black curve and fit the data (Thutupalli, 2014)