

3.4 Collective Effects
51
direction. This leads to different “dancing” figures, depending on the activity of both
particles and the sign of the response to an external gradient, called chemotactic or
antichemotactic when the self-propulsion axis rotates, respectively, to point parallel
or antiparallel to an imposed chemical gradient.
Different kinds of trajectories, depending on the design of the catalytic coverage
of an interacting pair, are sketched in Fig. 3.9. A pair of identical, mutually attractive
chemotactic swimmers form a stationary dimer (Fig. 3.9a). In panel (b), the swimmers chase one another, arriving at a final state of an active dimer with both polar
axes pointing in its direction of motion. Panel (c) shows a looping trajectory of a
rotating active dimer. Both chemotactic (d) and antichemotactic (e) particles may
scatter off one another when self-propulsion is stronger than attraction.
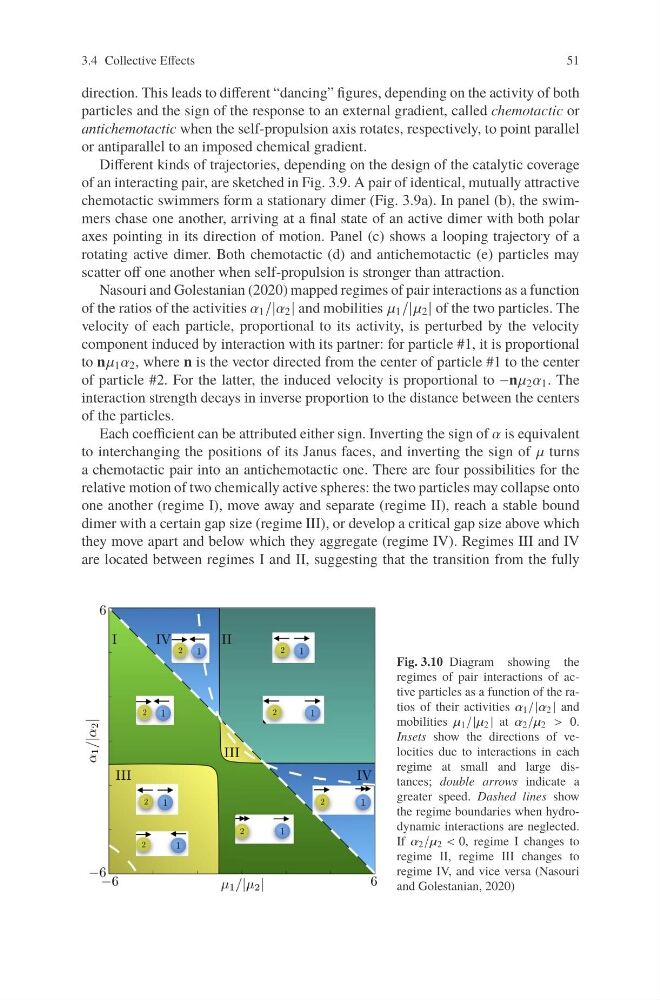
Nasouri and Golestanian (2020) mapped regimes of pair interactions as a function
of the ratios of the activities α 1 /|α 2 | and mobilities μ 1 /| μ 2 | of the two particles. The
velocity of each particle, proportional to its activity, is perturbed by the velocity
component induced by interaction with its partner: for particle #1, it is proportional
to nμ 1 α 2 , where n is the vector directed from the center of particle #1 to the center
of particle #2. For the latter, the induced velocity is proportional to −nμ 2 α 1 . The
interaction strength decays in inverse proportion to the distance between the centers
of the particles.
Each coefficient can be attributed either sign. Inverting the sign of α is equivalent
to interchanging the positions of its Janus faces, and inverting the sign of μ turns
a chemotactic pair into an antichemotactic one. There are four possibilities for the
relative motion of two chemically active spheres: the two particles may collapse onto
one another (regime I), move away and separate (regime II), reach a stable bound
dimer with a certain gap size (regime III), or develop a critical gap size above which
they move apart and below which they aggregate (regime IV). Regimes III and IV
are located between regimes I and II, suggesting that the transition from the fully
Fig. 3.10 Diagram showing the
regimes of pair interactions of active particles as a function of the ratios of their activities α 1 /|α 2 | and
mobilities μ 1 /|μ 2 | at α 2 /μ 2 > 0.
Insets show the directions of velocities due to interactions in each
regime at small and large distances; double arrows indicate a
greater speed. Dashed lines show
the regime boundaries when hydrodynamic interactions are neglected.
If α 2 /μ 2 < 0, regime I changes to
regime II, regime III changes to
regime IV, and vice versa (Nasouri
and Golestanian, 2020)
51
direction. This leads to different “dancing” figures, depending on the activity of both
particles and the sign of the response to an external gradient, called chemotactic or
antichemotactic when the self-propulsion axis rotates, respectively, to point parallel
or antiparallel to an imposed chemical gradient.
Different kinds of trajectories, depending on the design of the catalytic coverage
of an interacting pair, are sketched in Fig. 3.9. A pair of identical, mutually attractive
chemotactic swimmers form a stationary dimer (Fig. 3.9a). In panel (b), the swimmers chase one another, arriving at a final state of an active dimer with both polar
axes pointing in its direction of motion. Panel (c) shows a looping trajectory of a
rotating active dimer. Both chemotactic (d) and antichemotactic (e) particles may
scatter off one another when self-propulsion is stronger than attraction.
Nasouri and Golestanian (2020) mapped regimes of pair interactions as a function
of the ratios of the activities α 1 /|α 2 | and mobilities μ 1 /| μ 2 | of the two particles. The
velocity of each particle, proportional to its activity, is perturbed by the velocity
component induced by interaction with its partner: for particle #1, it is proportional
to nμ 1 α 2 , where n is the vector directed from the center of particle #1 to the center
of particle #2. For the latter, the induced velocity is proportional to −nμ 2 α 1 . The
interaction strength decays in inverse proportion to the distance between the centers
of the particles.
Each coefficient can be attributed either sign. Inverting the sign of α is equivalent
to interchanging the positions of its Janus faces, and inverting the sign of μ turns
a chemotactic pair into an antichemotactic one. There are four possibilities for the
relative motion of two chemically active spheres: the two particles may collapse onto
one another (regime I), move away and separate (regime II), reach a stable bound
dimer with a certain gap size (regime III), or develop a critical gap size above which
they move apart and below which they aggregate (regime IV). Regimes III and IV
are located between regimes I and II, suggesting that the transition from the fully
Fig. 3.10 Diagram showing the
regimes of pair interactions of active particles as a function of the ratios of their activities α 1 /|α 2 | and
mobilities μ 1 /|μ 2 | at α 2 /μ 2 > 0.
Insets show the directions of velocities due to interactions in each
regime at small and large distances; double arrows indicate a
greater speed. Dashed lines show
the regime boundaries when hydrodynamic interactions are neglected.
If α 2 /μ 2 < 0, regime I changes to
regime II, regime III changes to
regime IV, and vice versa (Nasouri
and Golestanian, 2020)