

2.5 Extensile and Contractile Activity
35
wall
wall
B
A
C
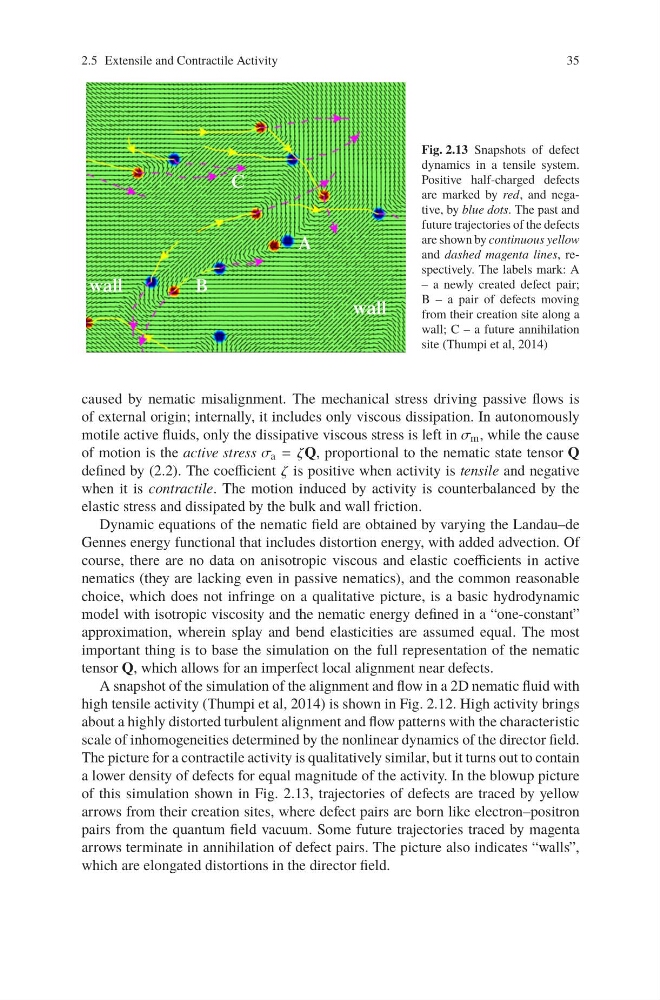
Fig. 2.13 Snapshots of defect
dynamics in a tensile system.
Positive half-charged defects
are marked by red, and negative, by blue dots. The past and
future trajectories of the defects
are shown by continuous yellow
and dashed magenta lines, respectively. The labels mark: A
– a newly created defect pair;
B – a pair of defects moving
from their creation site along a
wall; C – a future annihilation
site (Thumpi et al, 2014)
caused by nematic misalignment. The mechanical stress driving passive flows is
of external origin; internally, it includes only viscous dissipation. In autonomously
motile active fluids, only the dissipative viscous stress is left in σ m , while the cause
of motion is the active stress σ a = ζQ, proportional to the nematic state tensor Q
defined by (2.2). The coefficient ζ is positive when activity is tensile and negative
when it is contractile. The motion induced by activity is counterbalanced by the
elastic stress and dissipated by the bulk and wall friction.
Dynamic equations of the nematic field are obtained by varying the Landau–de
Gennes energy functional that includes distortion energy, with added advection. Of
course, there are no data on anisotropic viscous and elastic coefficients in active
nematics (they are lacking even in passive nematics), and the common reasonable
choice, which does not infringe on a qualitative picture, is a basic hydrodynamic
model with isotropic viscosity and the nematic energy defined in a “one-constant”
approximation, wherein splay and bend elasticities are assumed equal. The most
important thing is to base the simulation on the full representation of the nematic
tensor Q, which allows for an imperfect local alignment near defects.
A snapshot of the simulation of the alignment and flow in a 2D nematic fluid with
high tensile activity (Thumpi et al, 2014) is shown in Fig. 2.12. High activity brings
about a highly distorted turbulent alignment and flow patterns with the characteristic
scale of inhomogeneities determined by the nonlinear dynamics of the director field.
The picture for a contractile activity is qualitatively similar, but it turns out to contain
a lower density of defects for equal magnitude of the activity. In the blowup picture
of this simulation shown in Fig. 2.13, trajectories of defects are traced by yellow
arrows from their creation sites, where defect pairs are born like electron–positron
pairs from the quantum field vacuum. Some future trajectories traced by magenta
arrows terminate in annihilation of defect pairs. The picture also indicates “walls”,
which are elongated distortions in the director field.
35
wall
wall
B
A
C
Fig. 2.13 Snapshots of defect
dynamics in a tensile system.
Positive half-charged defects
are marked by red, and negative, by blue dots. The past and
future trajectories of the defects
are shown by continuous yellow
and dashed magenta lines, respectively. The labels mark: A
– a newly created defect pair;
B – a pair of defects moving
from their creation site along a
wall; C – a future annihilation
site (Thumpi et al, 2014)
caused by nematic misalignment. The mechanical stress driving passive flows is
of external origin; internally, it includes only viscous dissipation. In autonomously
motile active fluids, only the dissipative viscous stress is left in σ m , while the cause
of motion is the active stress σ a = ζQ, proportional to the nematic state tensor Q
defined by (2.2). The coefficient ζ is positive when activity is tensile and negative
when it is contractile. The motion induced by activity is counterbalanced by the
elastic stress and dissipated by the bulk and wall friction.
Dynamic equations of the nematic field are obtained by varying the Landau–de
Gennes energy functional that includes distortion energy, with added advection. Of
course, there are no data on anisotropic viscous and elastic coefficients in active
nematics (they are lacking even in passive nematics), and the common reasonable
choice, which does not infringe on a qualitative picture, is a basic hydrodynamic
model with isotropic viscosity and the nematic energy defined in a “one-constant”
approximation, wherein splay and bend elasticities are assumed equal. The most
important thing is to base the simulation on the full representation of the nematic
tensor Q, which allows for an imperfect local alignment near defects.
A snapshot of the simulation of the alignment and flow in a 2D nematic fluid with
high tensile activity (Thumpi et al, 2014) is shown in Fig. 2.12. High activity brings
about a highly distorted turbulent alignment and flow patterns with the characteristic
scale of inhomogeneities determined by the nonlinear dynamics of the director field.
The picture for a contractile activity is qualitatively similar, but it turns out to contain
a lower density of defects for equal magnitude of the activity. In the blowup picture
of this simulation shown in Fig. 2.13, trajectories of defects are traced by yellow
arrows from their creation sites, where defect pairs are born like electron–positron
pairs from the quantum field vacuum. Some future trajectories traced by magenta
arrows terminate in annihilation of defect pairs. The picture also indicates “walls”,
which are elongated distortions in the director field.