

1.5 Variations on Vicsek’s model
15
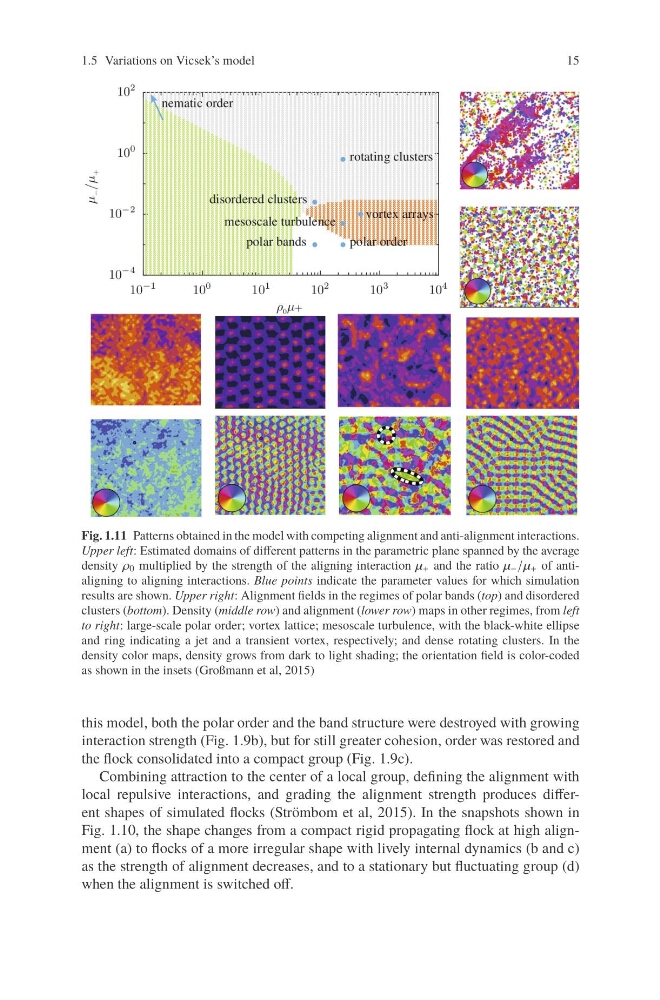
Fig. 1.11 Patterns obtained in the model with competing alignment and anti-alignment interactions.
Upper left: Estimated domains of different patterns in the parametric plane spanned by the average
density ρ 0 multiplied by the strength of the aligning interaction μ + and the ratio μ − /μ + of antialigning to aligning interactions. Blue points indicate the parameter values for which simulation
results are shown. Upper right: Alignment fields in the regimes of polar bands (top) and disordered
clusters (bottom). Density (middle row) and alignment (lower row) maps in other regimes, from left
to right: large-scale polar order; vortex lattice; mesoscale turbulence, with the black-white ellipse
and ring indicating a jet and a transient vortex, respectively; and dense rotating clusters. In the
density color maps, density grows from dark to light shading; the orientation field is color-coded
as shown in the insets (Großmann et al, 2015)
this model, both the polar order and the band structure were destroyed with growing
interaction strength (Fig. 1.9b), but for still greater cohesion, order was restored and
the flock consolidated into a compact group (Fig. 1.9c).
Combining attraction to the center of a local group, defining the alignment with
local repulsive interactions, and grading the alignment strength produces different shapes of simulated flocks (Strömbom et al, 2015). In the snapshots shown in
Fig. 1.10, the shape changes from a compact rigid propagating flock at high alignment (a) to flocks of a more irregular shape with lively internal dynamics (b and c)
as the strength of alignment decreases, and to a stationary but fluctuating group (d)
when the alignment is switched off.
15
Fig. 1.11 Patterns obtained in the model with competing alignment and anti-alignment interactions.
Upper left: Estimated domains of different patterns in the parametric plane spanned by the average
density ρ 0 multiplied by the strength of the aligning interaction μ + and the ratio μ − /μ + of antialigning to aligning interactions. Blue points indicate the parameter values for which simulation
results are shown. Upper right: Alignment fields in the regimes of polar bands (top) and disordered
clusters (bottom). Density (middle row) and alignment (lower row) maps in other regimes, from left
to right: large-scale polar order; vortex lattice; mesoscale turbulence, with the black-white ellipse
and ring indicating a jet and a transient vortex, respectively; and dense rotating clusters. In the
density color maps, density grows from dark to light shading; the orientation field is color-coded
as shown in the insets (Großmann et al, 2015)
this model, both the polar order and the band structure were destroyed with growing
interaction strength (Fig. 1.9b), but for still greater cohesion, order was restored and
the flock consolidated into a compact group (Fig. 1.9c).
Combining attraction to the center of a local group, defining the alignment with
local repulsive interactions, and grading the alignment strength produces different shapes of simulated flocks (Strömbom et al, 2015). In the snapshots shown in
Fig. 1.10, the shape changes from a compact rigid propagating flock at high alignment (a) to flocks of a more irregular shape with lively internal dynamics (b and c)
as the strength of alignment decreases, and to a stationary but fluctuating group (d)
when the alignment is switched off.