

194
8 Morphogenesis
Higher-order parastichies in Fig. 8.23b and c are more distinct. For 1 > V 2/3,
three precursors determine the angular position of a new primordium generating
intersecting spirals characterized by the Fibonacci numbers 3 and 5, as shown in
Fig. 8.23b. For 2/3 > V 1/2, the location depends on four precursors and
the parastichy includes 5 and 8 spirals connecting phylla with the differing birth
moments. Further bifurcations leading to sequential Fibonacci numbers follow at
decreasing intervals.
This model catches the essence of phyllotaxis, but in reality everything is not
that simple, since signaling and mechanical forces certainly play a role in this, as
in all other morphogenetic processes. The growth hormone auxin is instrumental in
initiating the formation of primordia, affecting the spatial and temporal intervals and
the growth rate, which may be variable. The underlying geometry may be spherical
or cylindrical rather than flat, and compressive stresses may lead to buckling of the
plant surface. Some of these factors were taken into account by Shipman and Newell
(2005) and in their later work. They asserted that Fibonacci patterns are persistent
among different growth scenarios, but may come out with topological defects when
bifurcations become less sharp, so that different parastichies coexist within a certain
parametric interval.
Development of differently shaped leaves follows the same rule due to Hofmeister,
now in the 1D geometry of a growing edge, with new primordia emerging at locations
that are sufficiently distant from the nearest primordia formed previously. Growth
directions are aligned with main veins, which is an evolutionary inheritance from
ancestral branching structures. Veins are formed and differentiate through positive
feedback, which creates narrow canals of auxin transport in a manner analogous to
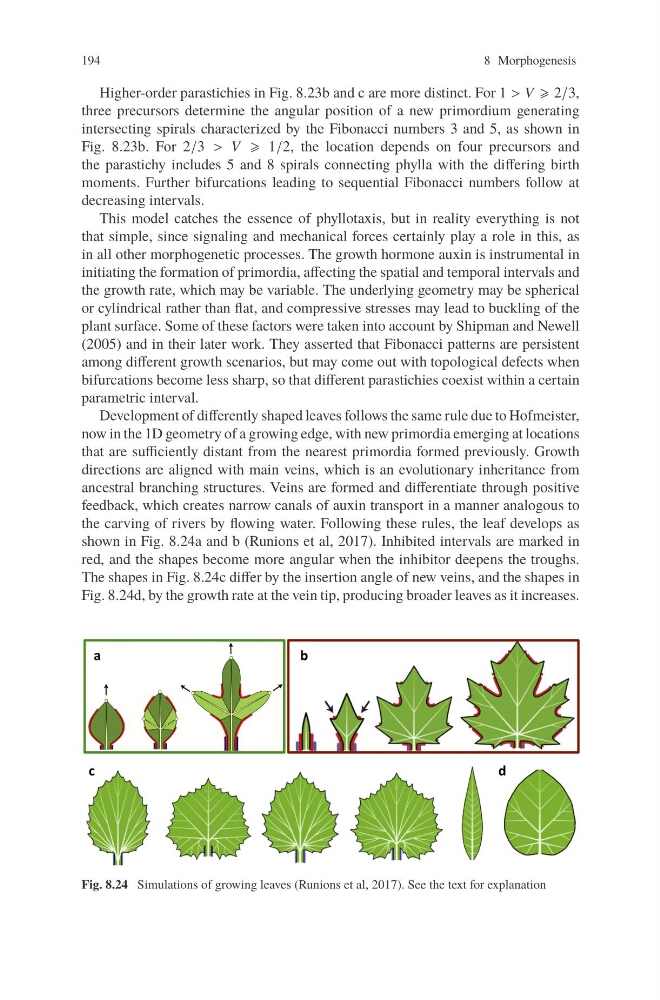
the carving of rivers by flowing water. Following these rules, the leaf develops as
shown in Fig. 8.24a and b (Runions et al, 2017). Inhibited intervals are marked in
red, and the shapes become more angular when the inhibitor deepens the troughs.
The shapes in Fig. 8.24c differ by the insertion angle of new veins, and the shapes in
Fig. 8.24d, by the growth rate at the vein tip, producing broader leaves as it increases.
Fig. 8.24 Simulations of growing leaves (Runions et al, 2017). See the text for explanation
8 Morphogenesis
Higher-order parastichies in Fig. 8.23b and c are more distinct. For 1 > V 2/3,
three precursors determine the angular position of a new primordium generating
intersecting spirals characterized by the Fibonacci numbers 3 and 5, as shown in
Fig. 8.23b. For 2/3 > V 1/2, the location depends on four precursors and
the parastichy includes 5 and 8 spirals connecting phylla with the differing birth
moments. Further bifurcations leading to sequential Fibonacci numbers follow at
decreasing intervals.
This model catches the essence of phyllotaxis, but in reality everything is not
that simple, since signaling and mechanical forces certainly play a role in this, as
in all other morphogenetic processes. The growth hormone auxin is instrumental in
initiating the formation of primordia, affecting the spatial and temporal intervals and
the growth rate, which may be variable. The underlying geometry may be spherical
or cylindrical rather than flat, and compressive stresses may lead to buckling of the
plant surface. Some of these factors were taken into account by Shipman and Newell
(2005) and in their later work. They asserted that Fibonacci patterns are persistent
among different growth scenarios, but may come out with topological defects when
bifurcations become less sharp, so that different parastichies coexist within a certain
parametric interval.
Development of differently shaped leaves follows the same rule due to Hofmeister,
now in the 1D geometry of a growing edge, with new primordia emerging at locations
that are sufficiently distant from the nearest primordia formed previously. Growth
directions are aligned with main veins, which is an evolutionary inheritance from
ancestral branching structures. Veins are formed and differentiate through positive
feedback, which creates narrow canals of auxin transport in a manner analogous to
the carving of rivers by flowing water. Following these rules, the leaf develops as
shown in Fig. 8.24a and b (Runions et al, 2017). Inhibited intervals are marked in
red, and the shapes become more angular when the inhibitor deepens the troughs.
The shapes in Fig. 8.24c differ by the insertion angle of new veins, and the shapes in
Fig. 8.24d, by the growth rate at the vein tip, producing broader leaves as it increases.
Fig. 8.24 Simulations of growing leaves (Runions et al, 2017). See the text for explanation