

190
8 Morphogenesis
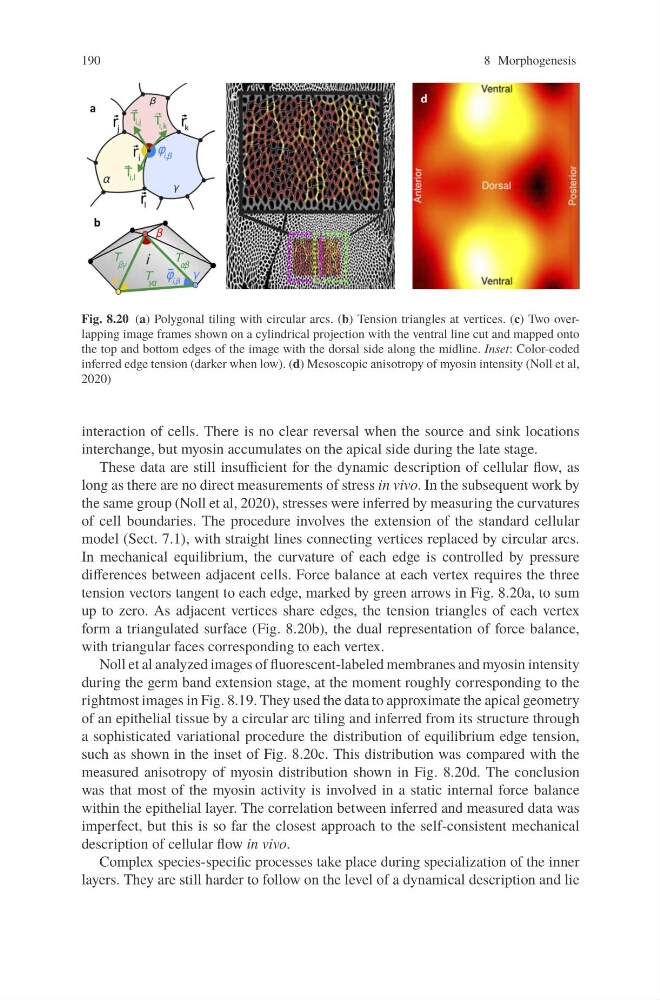
Fig. 8.20 (a) Polygonal tiling with circular arcs. (b) Tension triangles at vertices. (c) Two overlapping image frames shown on a cylindrical projection with the ventral line cut and mapped onto
the top and bottom edges of the image with the dorsal side along the midline. Inset: Color-coded
inferred edge tension (darker when low). (d) Mesoscopic anisotropy of myosin intensity (Noll et al,
2020)
interaction of cells. There is no clear reversal when the source and sink locations
interchange, but myosin accumulates on the apical side during the late stage.
These data are still insufficient for the dynamic description of cellular flow, as
long as there are no direct measurements of stress in vivo. In the subsequent work by
the same group (Noll et al, 2020), stresses were inferred by measuring the curvatures
of cell boundaries. The procedure involves the extension of the standard cellular
model (Sect. 7.1), with straight lines connecting vertices replaced by circular arcs.
In mechanical equilibrium, the curvature of each edge is controlled by pressure
differences between adjacent cells. Force balance at each vertex requires the three
tension vectors tangent to each edge, marked by green arrows in Fig. 8.20a, to sum
up to zero. As adjacent vertices share edges, the tension triangles of each vertex
form a triangulated surface (Fig. 8.20b), the dual representation of force balance,
with triangular faces corresponding to each vertex.
Noll et al analyzed images of fluorescent-labeled membranes and myosin intensity
during the germ band extension stage, at the moment roughly corresponding to the
rightmost images in Fig. 8.19. They used the data to approximate the apical geometry
of an epithelial tissue by a circular arc tiling and inferred from its structure through
a sophisticated variational procedure the distribution of equilibrium edge tension,
such as shown in the inset of Fig. 8.20c. This distribution was compared with the
measured anisotropy of myosin distribution shown in Fig. 8.20d. The conclusion
was that most of the myosin activity is involved in a static internal force balance
within the epithelial layer. The correlation between inferred and measured data was
imperfect, but this is so far the closest approach to the self-consistent mechanical
description of cellular flow in vivo.
Complex species-specific processes take place during specialization of the inner
layers. They are still harder to follow on the level of a dynamical description and lie
8 Morphogenesis
Fig. 8.20 (a) Polygonal tiling with circular arcs. (b) Tension triangles at vertices. (c) Two overlapping image frames shown on a cylindrical projection with the ventral line cut and mapped onto
the top and bottom edges of the image with the dorsal side along the midline. Inset: Color-coded
inferred edge tension (darker when low). (d) Mesoscopic anisotropy of myosin intensity (Noll et al,
2020)
interaction of cells. There is no clear reversal when the source and sink locations
interchange, but myosin accumulates on the apical side during the late stage.
These data are still insufficient for the dynamic description of cellular flow, as
long as there are no direct measurements of stress in vivo. In the subsequent work by
the same group (Noll et al, 2020), stresses were inferred by measuring the curvatures
of cell boundaries. The procedure involves the extension of the standard cellular
model (Sect. 7.1), with straight lines connecting vertices replaced by circular arcs.
In mechanical equilibrium, the curvature of each edge is controlled by pressure
differences between adjacent cells. Force balance at each vertex requires the three
tension vectors tangent to each edge, marked by green arrows in Fig. 8.20a, to sum
up to zero. As adjacent vertices share edges, the tension triangles of each vertex
form a triangulated surface (Fig. 8.20b), the dual representation of force balance,
with triangular faces corresponding to each vertex.
Noll et al analyzed images of fluorescent-labeled membranes and myosin intensity
during the germ band extension stage, at the moment roughly corresponding to the
rightmost images in Fig. 8.19. They used the data to approximate the apical geometry
of an epithelial tissue by a circular arc tiling and inferred from its structure through
a sophisticated variational procedure the distribution of equilibrium edge tension,
such as shown in the inset of Fig. 8.20c. This distribution was compared with the
measured anisotropy of myosin distribution shown in Fig. 8.20d. The conclusion
was that most of the myosin activity is involved in a static internal force balance
within the epithelial layer. The correlation between inferred and measured data was
imperfect, but this is so far the closest approach to the self-consistent mechanical
description of cellular flow in vivo.
Complex species-specific processes take place during specialization of the inner
layers. They are still harder to follow on the level of a dynamical description and lie