

7.7 Bending and Folding
165
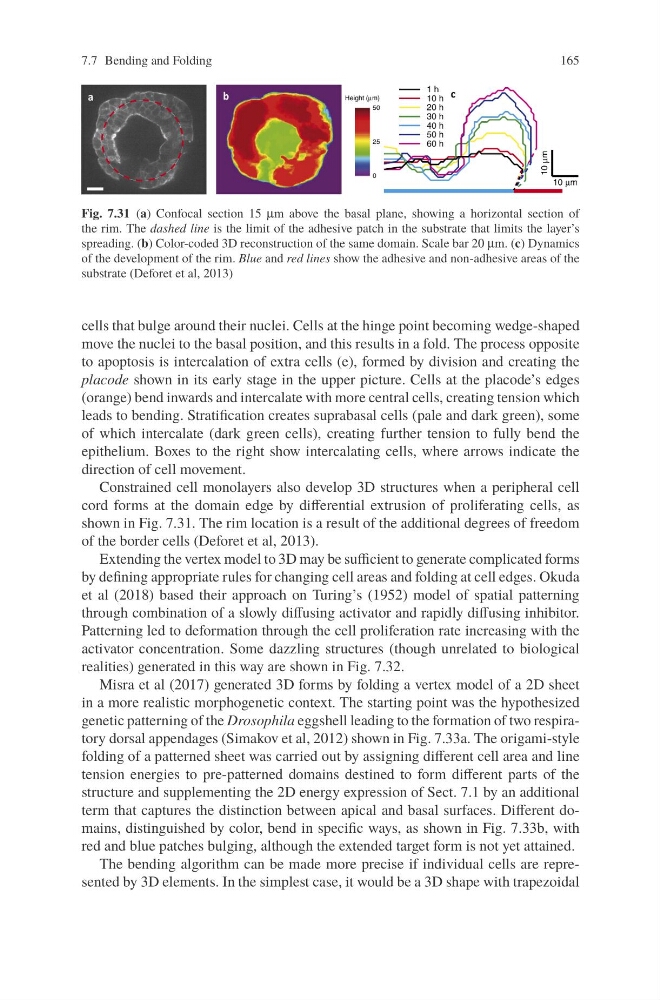
Fig. 7.31 (a) Confocal section 15 μm above the basal plane, showing a horizontal section of
the rim. The dashed line is the limit of the adhesive patch in the substrate that limits the layer’s
spreading. (b) Color-coded 3D reconstruction of the same domain. Scale bar 20 μm. (c) Dynamics
of the development of the rim. Blue and red lines show the adhesive and non-adhesive areas of the
substrate (Deforet et al, 2013)
cells that bulge around their nuclei. Cells at the hinge point becoming wedge-shaped
move the nuclei to the basal position, and this results in a fold. The process opposite
to apoptosis is intercalation of extra cells (e), formed by division and creating the
placode shown in its early stage in the upper picture. Cells at the placode’s edges
(orange) bend inwards and intercalate with more central cells, creating tension which
leads to bending. Stratification creates suprabasal cells (pale and dark green), some
of which intercalate (dark green cells), creating further tension to fully bend the
epithelium. Boxes to the right show intercalating cells, where arrows indicate the
direction of cell movement.
Constrained cell monolayers also develop 3D structures when a peripheral cell
cord forms at the domain edge by differential extrusion of proliferating cells, as
shown in Fig. 7.31. The rim location is a result of the additional degrees of freedom
of the border cells (Deforet et al, 2013).
Extending the vertex model to 3D may be sufficient to generate complicated forms
by defining appropriate rules for changing cell areas and folding at cell edges. Okuda
et al (2018) based their approach on Turing’s (1952) model of spatial patterning
through combination of a slowly diffusing activator and rapidly diffusing inhibitor.
Patterning led to deformation through the cell proliferation rate increasing with the
activator concentration. Some dazzling structures (though unrelated to biological
realities) generated in this way are shown in Fig. 7.32.
Misra et al (2017) generated 3D forms by folding a vertex model of a 2D sheet
in a more realistic morphogenetic context. The starting point was the hypothesized
genetic patterning of the Drosophila eggshell leading to the formation of two respiratory dorsal appendages (Simakov et al, 2012) shown in Fig. 7.33a. The origami-style
folding of a patterned sheet was carried out by assigning different cell area and line
tension energies to pre-patterned domains destined to form different parts of the
structure and supplementing the 2D energy expression of Sect. 7.1 by an additional
term that captures the distinction between apical and basal surfaces. Different domains, distinguished by color, bend in specific ways, as shown in Fig. 7.33b, with
red and blue patches bulging, although the extended target form is not yet attained.
The bending algorithm can be made more precise if individual cells are represented by 3D elements. In the simplest case, it would be a 3D shape with trapezoidal
165
Fig. 7.31 (a) Confocal section 15 μm above the basal plane, showing a horizontal section of
the rim. The dashed line is the limit of the adhesive patch in the substrate that limits the layer’s
spreading. (b) Color-coded 3D reconstruction of the same domain. Scale bar 20 μm. (c) Dynamics
of the development of the rim. Blue and red lines show the adhesive and non-adhesive areas of the
substrate (Deforet et al, 2013)
cells that bulge around their nuclei. Cells at the hinge point becoming wedge-shaped
move the nuclei to the basal position, and this results in a fold. The process opposite
to apoptosis is intercalation of extra cells (e), formed by division and creating the
placode shown in its early stage in the upper picture. Cells at the placode’s edges
(orange) bend inwards and intercalate with more central cells, creating tension which
leads to bending. Stratification creates suprabasal cells (pale and dark green), some
of which intercalate (dark green cells), creating further tension to fully bend the
epithelium. Boxes to the right show intercalating cells, where arrows indicate the
direction of cell movement.
Constrained cell monolayers also develop 3D structures when a peripheral cell
cord forms at the domain edge by differential extrusion of proliferating cells, as
shown in Fig. 7.31. The rim location is a result of the additional degrees of freedom
of the border cells (Deforet et al, 2013).
Extending the vertex model to 3D may be sufficient to generate complicated forms
by defining appropriate rules for changing cell areas and folding at cell edges. Okuda
et al (2018) based their approach on Turing’s (1952) model of spatial patterning
through combination of a slowly diffusing activator and rapidly diffusing inhibitor.
Patterning led to deformation through the cell proliferation rate increasing with the
activator concentration. Some dazzling structures (though unrelated to biological
realities) generated in this way are shown in Fig. 7.32.
Misra et al (2017) generated 3D forms by folding a vertex model of a 2D sheet
in a more realistic morphogenetic context. The starting point was the hypothesized
genetic patterning of the Drosophila eggshell leading to the formation of two respiratory dorsal appendages (Simakov et al, 2012) shown in Fig. 7.33a. The origami-style
folding of a patterned sheet was carried out by assigning different cell area and line
tension energies to pre-patterned domains destined to form different parts of the
structure and supplementing the 2D energy expression of Sect. 7.1 by an additional
term that captures the distinction between apical and basal surfaces. Different domains, distinguished by color, bend in specific ways, as shown in Fig. 7.33b, with
red and blue patches bulging, although the extended target form is not yet attained.
The bending algorithm can be made more precise if individual cells are represented by 3D elements. In the simplest case, it would be a 3D shape with trapezoidal