

7.6 Polarization and Defects
161
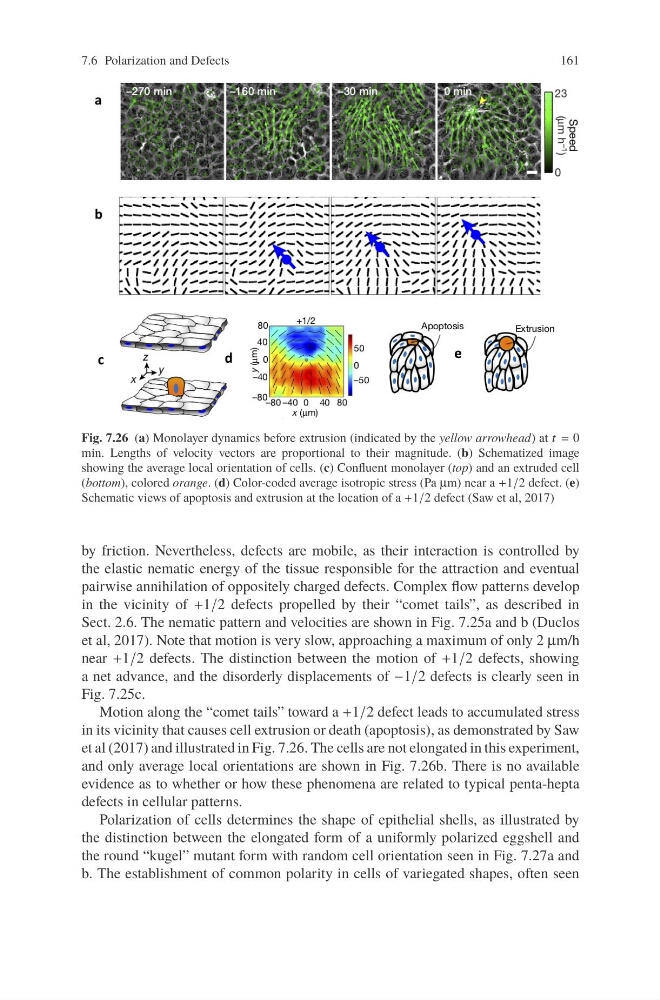
Fig. 7.26 (a) Monolayer dynamics before extrusion (indicated by the yellow arrowhead) at t = 0
min. Lengths of velocity vectors are proportional to their magnitude. (b) Schematized image
showing the average local orientation of cells. (c) Confluent monolayer (top) and an extruded cell
(bottom), colored orange. (d) Color-coded average isotropic stress (Pa μm) near a +1/2 defect. (e)
Schematic views of apoptosis and extrusion at the location of a +1/2 defect (Saw et al, 2017)
by friction. Nevertheless, defects are mobile, as their interaction is controlled by
the elastic nematic energy of the tissue responsible for the attraction and eventual
pairwise annihilation of oppositely charged defects. Complex flow patterns develop
in the vicinity of +1/2 defects propelled by their “comet tails”, as described in
Sect. 2.6. The nematic pattern and velocities are shown in Fig. 7.25a and b (Duclos
et al, 2017). Note that motion is very slow, approaching a maximum of only 2 μm/h
near +1/2 defects. The distinction between the motion of +1/2 defects, showing
a net advance, and the disorderly displacements of −1/2 defects is clearly seen in
Fig. 7.25c.
Motion along the “comet tails” toward a +1/2 defect leads to accumulated stress
in its vicinity that causes cell extrusion or death (apoptosis), as demonstrated by Saw
et al (2017) and illustrated in Fig. 7.26. The cells are not elongated in this experiment,
and only average local orientations are shown in Fig. 7.26b. There is no available
evidence as to whether or how these phenomena are related to typical penta-hepta
defects in cellular patterns.
Polarization of cells determines the shape of epithelial shells, as illustrated by
the distinction between the elongated form of a uniformly polarized eggshell and
the round “kugel” mutant form with random cell orientation seen in Fig. 7.27a and
b. The establishment of common polarity in cells of variegated shapes, often seen
161
Fig. 7.26 (a) Monolayer dynamics before extrusion (indicated by the yellow arrowhead) at t = 0
min. Lengths of velocity vectors are proportional to their magnitude. (b) Schematized image
showing the average local orientation of cells. (c) Confluent monolayer (top) and an extruded cell
(bottom), colored orange. (d) Color-coded average isotropic stress (Pa μm) near a +1/2 defect. (e)
Schematic views of apoptosis and extrusion at the location of a +1/2 defect (Saw et al, 2017)
by friction. Nevertheless, defects are mobile, as their interaction is controlled by
the elastic nematic energy of the tissue responsible for the attraction and eventual
pairwise annihilation of oppositely charged defects. Complex flow patterns develop
in the vicinity of +1/2 defects propelled by their “comet tails”, as described in
Sect. 2.6. The nematic pattern and velocities are shown in Fig. 7.25a and b (Duclos
et al, 2017). Note that motion is very slow, approaching a maximum of only 2 μm/h
near +1/2 defects. The distinction between the motion of +1/2 defects, showing
a net advance, and the disorderly displacements of −1/2 defects is clearly seen in
Fig. 7.25c.
Motion along the “comet tails” toward a +1/2 defect leads to accumulated stress
in its vicinity that causes cell extrusion or death (apoptosis), as demonstrated by Saw
et al (2017) and illustrated in Fig. 7.26. The cells are not elongated in this experiment,
and only average local orientations are shown in Fig. 7.26b. There is no available
evidence as to whether or how these phenomena are related to typical penta-hepta
defects in cellular patterns.
Polarization of cells determines the shape of epithelial shells, as illustrated by
the distinction between the elongated form of a uniformly polarized eggshell and
the round “kugel” mutant form with random cell orientation seen in Fig. 7.27a and
b. The establishment of common polarity in cells of variegated shapes, often seen