

154
7 Live Tissues
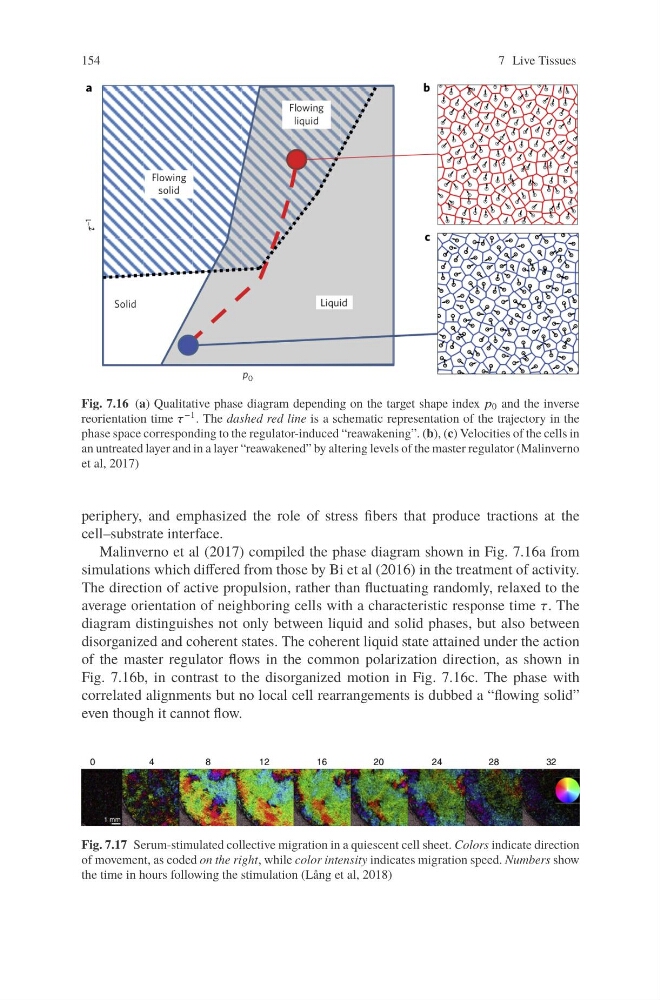
Fig. 7.16 (a) Qualitative phase diagram depending on the target shape index p 0 and the inverse
reorientation time τ −1 . The dashed red line is a schematic representation of the trajectory in the
phase space corresponding to the regulator-induced “reawakening”. (b), (c) Velocities of the cells in
an untreated layer and in a layer “reawakened” by altering levels of the master regulator (Malinverno
et al, 2017)
periphery, and emphasized the role of stress fibers that produce tractions at the
cell–substrate interface.
Malinverno et al (2017) compiled the phase diagram shown in Fig. 7.16a from
simulations which differed from those by Bi et al (2016) in the treatment of activity.
The direction of active propulsion, rather than fluctuating randomly, relaxed to the
average orientation of neighboring cells with a characteristic response time τ. The
diagram distinguishes not only between liquid and solid phases, but also between
disorganized and coherent states. The coherent liquid state attained under the action
of the master regulator flows in the common polarization direction, as shown in
Fig. 7.16b, in contrast to the disorganized motion in Fig. 7.16c. The phase with
correlated alignments but no local cell rearrangements is dubbed a “flowing solid”
even though it cannot flow.
Fig. 7.17 Serum-stimulated collective migration in a quiescent cell sheet. Colors indicate direction
of movement, as coded on the right, while color intensity indicates migration speed. Numbers show
the time in hours following the stimulation (Lång et al, 2018)
7 Live Tissues
Fig. 7.16 (a) Qualitative phase diagram depending on the target shape index p 0 and the inverse
reorientation time τ −1 . The dashed red line is a schematic representation of the trajectory in the
phase space corresponding to the regulator-induced “reawakening”. (b), (c) Velocities of the cells in
an untreated layer and in a layer “reawakened” by altering levels of the master regulator (Malinverno
et al, 2017)
periphery, and emphasized the role of stress fibers that produce tractions at the
cell–substrate interface.
Malinverno et al (2017) compiled the phase diagram shown in Fig. 7.16a from
simulations which differed from those by Bi et al (2016) in the treatment of activity.
The direction of active propulsion, rather than fluctuating randomly, relaxed to the
average orientation of neighboring cells with a characteristic response time τ. The
diagram distinguishes not only between liquid and solid phases, but also between
disorganized and coherent states. The coherent liquid state attained under the action
of the master regulator flows in the common polarization direction, as shown in
Fig. 7.16b, in contrast to the disorganized motion in Fig. 7.16c. The phase with
correlated alignments but no local cell rearrangements is dubbed a “flowing solid”
even though it cannot flow.
Fig. 7.17 Serum-stimulated collective migration in a quiescent cell sheet. Colors indicate direction
of movement, as coded on the right, while color intensity indicates migration speed. Numbers show
the time in hours following the stimulation (Lång et al, 2018)