

7.3 Jamming and Liquefaction
153
found, as expected, to shift the jamming transition in a similar way to smaller values
of p 0 . The model was further extended allowing for cell overlap, interpreted as a
precursor for cell extrusion (Loewe et al, 2020). In this case, the melting transition
became discontinuous, and an intermittent regime with alternating glassy and fluid
states was observed close to the transition. Li et al (2019) found that heterogeneity
of the target shape factor p 0 always enhanced the layer’s rigidity.
However, the above results, united by a common approach, are still not the end
of the story, as they do not elucidate the influence of many important factors, such
as chemical signaling, substrate traction, and the internal structure of the cell. The
target form factor p 0 is a formal parameter, and, although it certainly plays a crucial
role in the jamming transition, it remains unclear which physical and biochemical
factors govern the choice of its level. Complex biochemical cues related to asthma
were at work in the study by Park et al (2015), but it remained unclear in what way
they influenced the cell geometry.
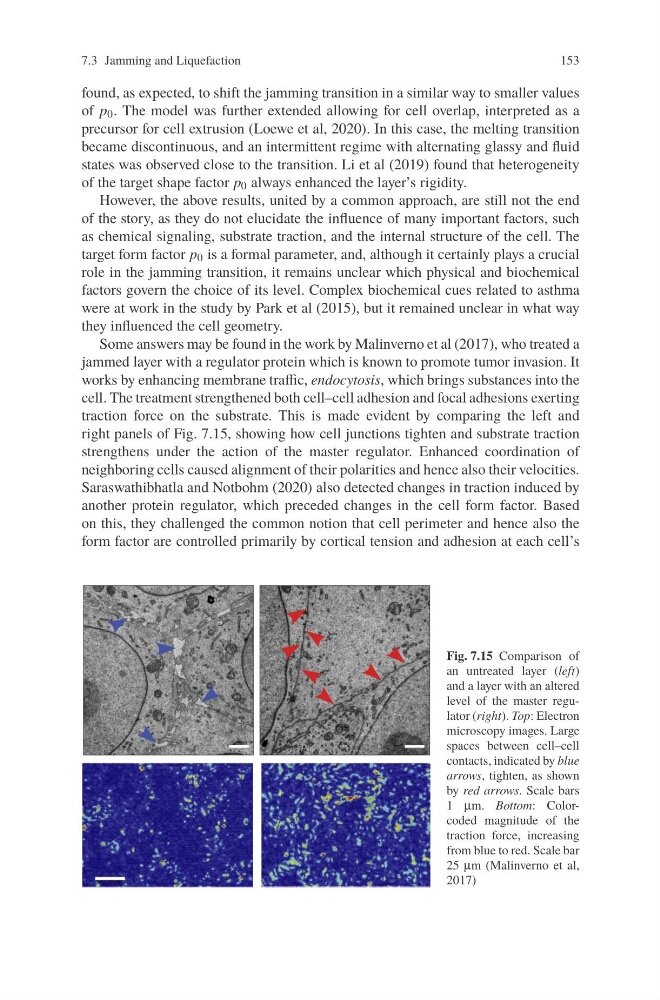
Some answers may be found in the work by Malinverno et al (2017), who treated a
jammed layer with a regulator protein which is known to promote tumor invasion. It
works by enhancing membrane traffic, endocytosis, which brings substances into the
cell. The treatment strengthened both cell–cell adhesion and focal adhesions exerting
traction force on the substrate. This is made evident by comparing the left and
right panels of Fig. 7.15, showing how cell junctions tighten and substrate traction
strengthens under the action of the master regulator. Enhanced coordination of
neighboring cells caused alignment of their polarities and hence also their velocities.
Saraswathibhatla and Notbohm (2020) also detected changes in traction induced by
another protein regulator, which preceded changes in the cell form factor. Based
on this, they challenged the common notion that cell perimeter and hence also the
form factor are controlled primarily by cortical tension and adhesion at each cell’s
Fig. 7.15 Comparison of
an untreated layer (left)
and a layer with an altered
level of the master regulator (right). Top: Electron
microscopy images. Large
spaces between cell–cell
contacts, indicated by blue
arrows, tighten, as shown
by red arrows. Scale bars
1 μm. Bottom: Colorcoded magnitude of the
traction force, increasing
from blue to red. Scale bar
25 μm (Malinverno et al,
2017)
153
found, as expected, to shift the jamming transition in a similar way to smaller values
of p 0 . The model was further extended allowing for cell overlap, interpreted as a
precursor for cell extrusion (Loewe et al, 2020). In this case, the melting transition
became discontinuous, and an intermittent regime with alternating glassy and fluid
states was observed close to the transition. Li et al (2019) found that heterogeneity
of the target shape factor p 0 always enhanced the layer’s rigidity.
However, the above results, united by a common approach, are still not the end
of the story, as they do not elucidate the influence of many important factors, such
as chemical signaling, substrate traction, and the internal structure of the cell. The
target form factor p 0 is a formal parameter, and, although it certainly plays a crucial
role in the jamming transition, it remains unclear which physical and biochemical
factors govern the choice of its level. Complex biochemical cues related to asthma
were at work in the study by Park et al (2015), but it remained unclear in what way
they influenced the cell geometry.
Some answers may be found in the work by Malinverno et al (2017), who treated a
jammed layer with a regulator protein which is known to promote tumor invasion. It
works by enhancing membrane traffic, endocytosis, which brings substances into the
cell. The treatment strengthened both cell–cell adhesion and focal adhesions exerting
traction force on the substrate. This is made evident by comparing the left and
right panels of Fig. 7.15, showing how cell junctions tighten and substrate traction
strengthens under the action of the master regulator. Enhanced coordination of
neighboring cells caused alignment of their polarities and hence also their velocities.
Saraswathibhatla and Notbohm (2020) also detected changes in traction induced by
another protein regulator, which preceded changes in the cell form factor. Based
on this, they challenged the common notion that cell perimeter and hence also the
form factor are controlled primarily by cortical tension and adhesion at each cell’s
Fig. 7.15 Comparison of
an untreated layer (left)
and a layer with an altered
level of the master regulator (right). Top: Electron
microscopy images. Large
spaces between cell–cell
contacts, indicated by blue
arrows, tighten, as shown
by red arrows. Scale bars
1 μm. Bottom: Colorcoded magnitude of the
traction force, increasing
from blue to red. Scale bar
25 μm (Malinverno et al,
2017)