

152
7 Live Tissues
computations produced the critical number p ∗
0 = 3.81. Targeting the parameters to
produce more elongated cells with p 0 > p ∗
0 led to a fluid pattern, while more squatty
cells produced at p 0 < p ∗
0 formed a glassy tessellation. Intuitively, intercalations
should be easier for elongated cells containing shorter edges, and indeed, measured
average energy barriers of intercalation decreased almost linearly with p 0 . The critical
value just slightly exceeds the corresponding value for the regular hexagonal pattern,
p hex ≈ 3.72, and is very close to the value for a regular pentagon. However, it is
impossible to tile a plane with pentagons, and setting p 0 > p hex always produces a
disordered pattern, although it is still solid below p ∗
0 .
The prediction found its confirmation in experiments with human bronchial epithelial cells taken from asthmatic and non-asthmatic donors (Park et al, 2015). Both
evolved from an immature fluid-like phase approaching the jamming transition at
the predicted geometrical threshold, but in the case of asthmatic donors, jamming
was delayed substantially or disrupted altogether. The bronchial epithelium is subject to repeated mechanical perturbations and is exposed to harmful environmental
pollutants, allergens, etc., and healthy tissues self-repair by resettling to a quiescent
glassy state. Thus, such a simple indicator as the prevailing cell shape appears to
have a diagnostic value.
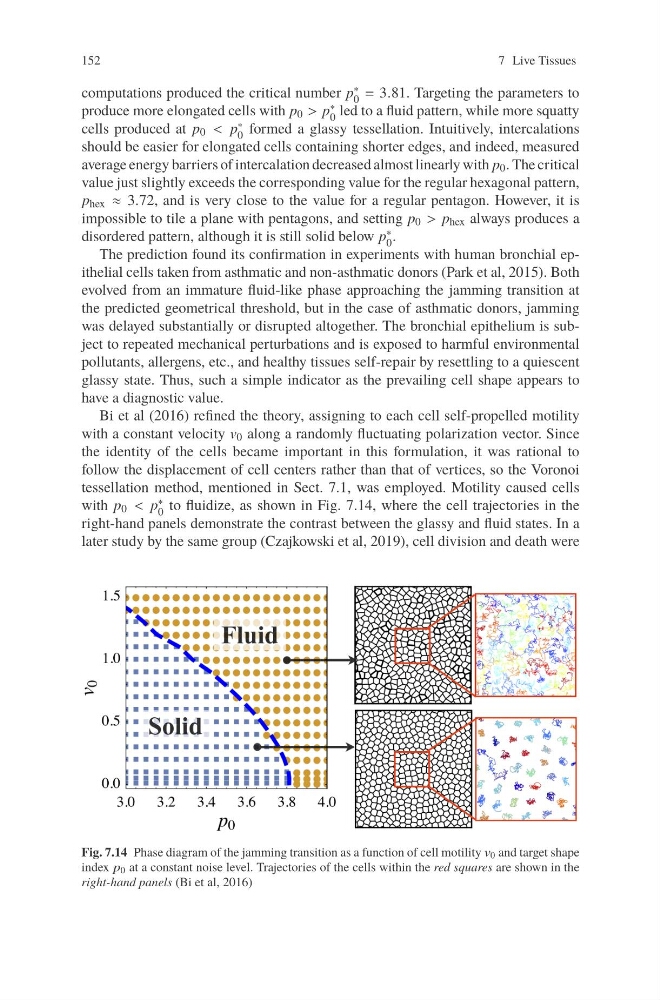
Bi et al (2016) refined the theory, assigning to each cell self-propelled motility
with a constant velocity v 0 along a randomly fluctuating polarization vector. Since
the identity of the cells became important in this formulation, it was rational to
follow the displacement of cell centers rather than that of vertices, so the Voronoi
tessellation method, mentioned in Sect. 7.1, was employed. Motility caused cells
with p 0 < p ∗
0 to fluidize, as shown in Fig. 7.14, where the cell trajectories in the
right-hand panels demonstrate the contrast between the glassy and fluid states. In a
later study by the same group (Czajkowski et al, 2019), cell division and death were
Fig. 7.14 Phase diagram of the jamming transition as a function of cell motility v 0 and target shape
index p 0 at a constant noise level. Trajectories of the cells within the red squares are shown in the
right-hand panels (Bi et al, 2016)
7 Live Tissues
computations produced the critical number p ∗
0 = 3.81. Targeting the parameters to
produce more elongated cells with p 0 > p ∗
0 led to a fluid pattern, while more squatty
cells produced at p 0 < p ∗
0 formed a glassy tessellation. Intuitively, intercalations
should be easier for elongated cells containing shorter edges, and indeed, measured
average energy barriers of intercalation decreased almost linearly with p 0 . The critical
value just slightly exceeds the corresponding value for the regular hexagonal pattern,
p hex ≈ 3.72, and is very close to the value for a regular pentagon. However, it is
impossible to tile a plane with pentagons, and setting p 0 > p hex always produces a
disordered pattern, although it is still solid below p ∗
0 .
The prediction found its confirmation in experiments with human bronchial epithelial cells taken from asthmatic and non-asthmatic donors (Park et al, 2015). Both
evolved from an immature fluid-like phase approaching the jamming transition at
the predicted geometrical threshold, but in the case of asthmatic donors, jamming
was delayed substantially or disrupted altogether. The bronchial epithelium is subject to repeated mechanical perturbations and is exposed to harmful environmental
pollutants, allergens, etc., and healthy tissues self-repair by resettling to a quiescent
glassy state. Thus, such a simple indicator as the prevailing cell shape appears to
have a diagnostic value.
Bi et al (2016) refined the theory, assigning to each cell self-propelled motility
with a constant velocity v 0 along a randomly fluctuating polarization vector. Since
the identity of the cells became important in this formulation, it was rational to
follow the displacement of cell centers rather than that of vertices, so the Voronoi
tessellation method, mentioned in Sect. 7.1, was employed. Motility caused cells
with p 0 < p ∗
0 to fluidize, as shown in Fig. 7.14, where the cell trajectories in the
right-hand panels demonstrate the contrast between the glassy and fluid states. In a
later study by the same group (Czajkowski et al, 2019), cell division and death were
Fig. 7.14 Phase diagram of the jamming transition as a function of cell motility v 0 and target shape
index p 0 at a constant noise level. Trajectories of the cells within the red squares are shown in the
right-hand panels (Bi et al, 2016)