

7.2 Forces in Migrating Layers
147
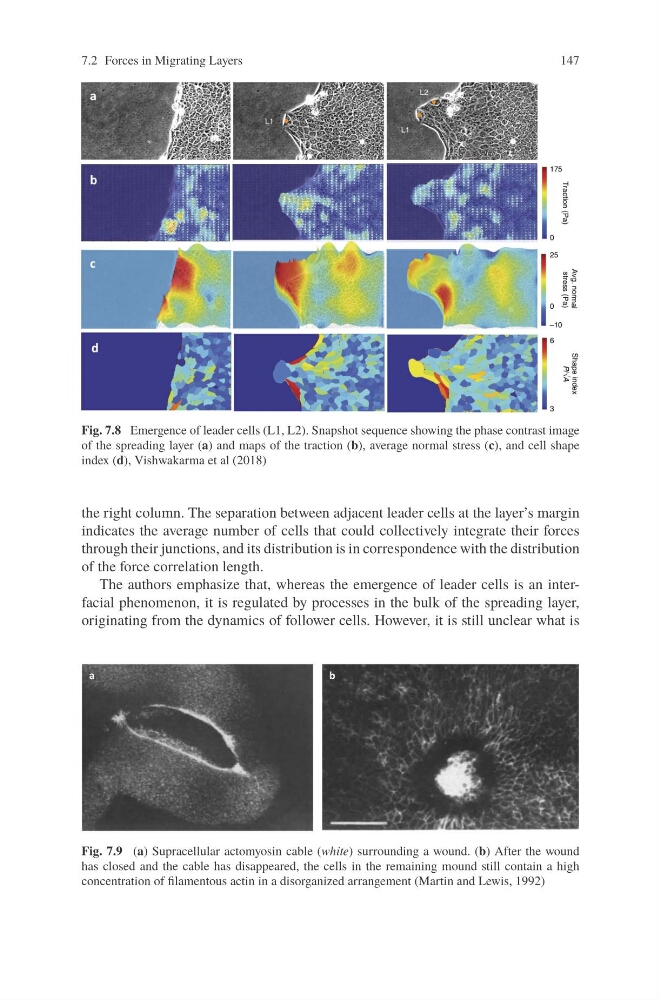
Fig. 7.8 Emergence of leader cells (L1, L2). Snapshot sequence showing the phase contrast image
of the spreading layer (a) and maps of the traction (b), average normal stress (c), and cell shape
index (d), Vishwakarma et al (2018)
the right column. The separation between adjacent leader cells at the layer’s margin
indicates the average number of cells that could collectively integrate their forces
through their junctions, and its distribution is in correspondence with the distribution
of the force correlation length.
The authors emphasize that, whereas the emergence of leader cells is an interfacial phenomenon, it is regulated by processes in the bulk of the spreading layer,
originating from the dynamics of follower cells. However, it is still unclear what is
Fig. 7.9 (a) Supracellular actomyosin cable (white) surrounding a wound. (b) After the wound
has closed and the cable has disappeared, the cells in the remaining mound still contain a high
concentration of filamentous actin in a disorganized arrangement (Martin and Lewis, 1992)
147
Fig. 7.8 Emergence of leader cells (L1, L2). Snapshot sequence showing the phase contrast image
of the spreading layer (a) and maps of the traction (b), average normal stress (c), and cell shape
index (d), Vishwakarma et al (2018)
the right column. The separation between adjacent leader cells at the layer’s margin
indicates the average number of cells that could collectively integrate their forces
through their junctions, and its distribution is in correspondence with the distribution
of the force correlation length.
The authors emphasize that, whereas the emergence of leader cells is an interfacial phenomenon, it is regulated by processes in the bulk of the spreading layer,
originating from the dynamics of follower cells. However, it is still unclear what is
Fig. 7.9 (a) Supracellular actomyosin cable (white) surrounding a wound. (b) After the wound
has closed and the cable has disappeared, the cells in the remaining mound still contain a high
concentration of filamentous actin in a disorganized arrangement (Martin and Lewis, 1992)