

146
7 Live Tissues
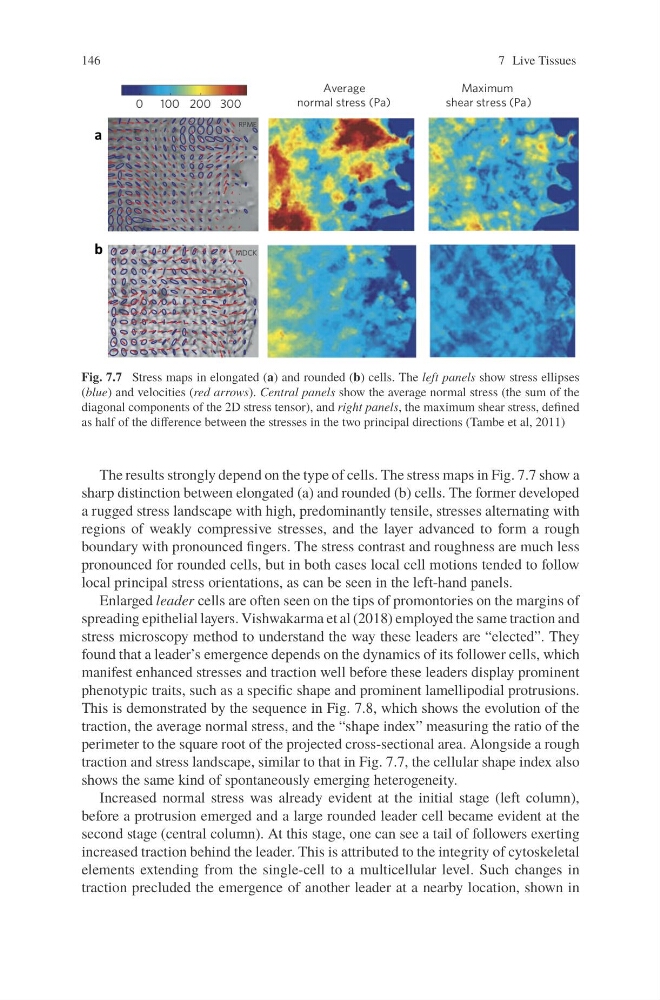
Fig. 7.7 Stress maps in elongated (a) and rounded (b) cells. The left panels show stress ellipses
(blue) and velocities (red arrows). Central panels show the average normal stress (the sum of the
diagonal components of the 2D stress tensor), and right panels, the maximum shear stress, defined
as half of the difference between the stresses in the two principal directions (Tambe et al, 2011)
The results strongly depend on the type of cells. The stress maps in Fig. 7.7 show a
sharp distinction between elongated (a) and rounded (b) cells. The former developed
a rugged stress landscape with high, predominantly tensile, stresses alternating with
regions of weakly compressive stresses, and the layer advanced to form a rough
boundary with pronounced fingers. The stress contrast and roughness are much less
pronounced for rounded cells, but in both cases local cell motions tended to follow
local principal stress orientations, as can be seen in the left-hand panels.
Enlarged leader cells are often seen on the tips of promontories on the margins of
spreading epithelial layers. Vishwakarma et al (2018) employed the same traction and
stress microscopy method to understand the way these leaders are “elected”. They
found that a leader’s emergence depends on the dynamics of its follower cells, which
manifest enhanced stresses and traction well before these leaders display prominent
phenotypic traits, such as a specific shape and prominent lamellipodial protrusions.
This is demonstrated by the sequence in Fig. 7.8, which shows the evolution of the
traction, the average normal stress, and the “shape index” measuring the ratio of the
perimeter to the square root of the projected cross-sectional area. Alongside a rough
traction and stress landscape, similar to that in Fig. 7.7, the cellular shape index also
shows the same kind of spontaneously emerging heterogeneity.
Increased normal stress was already evident at the initial stage (left column),
before a protrusion emerged and a large rounded leader cell became evident at the
second stage (central column). At this stage, one can see a tail of followers exerting
increased traction behind the leader. This is attributed to the integrity of cytoskeletal
elements extending from the single-cell to a multicellular level. Such changes in
traction precluded the emergence of another leader at a nearby location, shown in
7 Live Tissues
Fig. 7.7 Stress maps in elongated (a) and rounded (b) cells. The left panels show stress ellipses
(blue) and velocities (red arrows). Central panels show the average normal stress (the sum of the
diagonal components of the 2D stress tensor), and right panels, the maximum shear stress, defined
as half of the difference between the stresses in the two principal directions (Tambe et al, 2011)
The results strongly depend on the type of cells. The stress maps in Fig. 7.7 show a
sharp distinction between elongated (a) and rounded (b) cells. The former developed
a rugged stress landscape with high, predominantly tensile, stresses alternating with
regions of weakly compressive stresses, and the layer advanced to form a rough
boundary with pronounced fingers. The stress contrast and roughness are much less
pronounced for rounded cells, but in both cases local cell motions tended to follow
local principal stress orientations, as can be seen in the left-hand panels.
Enlarged leader cells are often seen on the tips of promontories on the margins of
spreading epithelial layers. Vishwakarma et al (2018) employed the same traction and
stress microscopy method to understand the way these leaders are “elected”. They
found that a leader’s emergence depends on the dynamics of its follower cells, which
manifest enhanced stresses and traction well before these leaders display prominent
phenotypic traits, such as a specific shape and prominent lamellipodial protrusions.
This is demonstrated by the sequence in Fig. 7.8, which shows the evolution of the
traction, the average normal stress, and the “shape index” measuring the ratio of the
perimeter to the square root of the projected cross-sectional area. Alongside a rough
traction and stress landscape, similar to that in Fig. 7.7, the cellular shape index also
shows the same kind of spontaneously emerging heterogeneity.
Increased normal stress was already evident at the initial stage (left column),
before a protrusion emerged and a large rounded leader cell became evident at the
second stage (central column). At this stage, one can see a tail of followers exerting
increased traction behind the leader. This is attributed to the integrity of cytoskeletal
elements extending from the single-cell to a multicellular level. Such changes in
traction precluded the emergence of another leader at a nearby location, shown in