

7.1 Cellular Models
143
as cell centers, evolve, which necessitates recomputing the tiling at each step. Even
if a simulation starts from a regular hexagonal tessellation, defects naturally emerge
as a result of cell division, as sketched in Fig. 7.3d. Repeated divisions in the
sequence Fig. 7.3a–c lead to growing randomization of the tiling. Another generic
rearrangement event, also adding to disorder, is intercalation (Fig. 7.3e) proceeding
via an evanescent four-fold junction.
The vertex model was originally applied to soap foams evolving to minimize
the total length of bonds between vertices (Nagai et al, 1988). This, naturally, led
to a coarsening sequence, with the size of cells increasing as vertices collide and
bonds annihilate. When Nagai and Honda (2001) applied this method to cellular
patterns, cell mergers had to be prevented. They proposed, therefore, to evolve a
vertex model in a direction minimizing the energy, defined as the sum over the tiling
of the terms characterizing both length and area elements. The former, as in the case
of foams, is the sum of the energies of all bonds, which are now better referred to
as edges, defined as their lengths multiplied by some coefficients quantifying the
respective line tensions depending on the properties of adjacent cells. The second
group of terms are square deviations of the cell area from a preferred standard value,
which may also be different for cells of different kinds, multiplied by appropriate
coefficients. The essential area and boundary terms are also present in formulations
of the cellular Potts model.
The mechanical force acting on a node, or vertex, is defined as the derivative
of the energy with respect to its position. Rather than solving a huge system of
differential equations, evolution can be followed by testing the change of energy due
to displacement of individual nodes, but, since all of them are tied in a common
interaction network, the results of a simulation may be sensitive to a sequencing
algorithm. The parameters entering each term can be assigned according to specific
features of a particular problem at hand, and the evolution of the tiling can be coupled
with other processes, as in the examples to follow. In the simulations by Nagai and
Honda, all coefficients were identical and only the relative strength of area and line
contributions could be adjusted. Farhadifar et al (2007), often cited as the originators
of the method, added to the energy expression the sum of the squared cell perimeters
multiplied by a coefficient that could reflect, for example, contractility of the actin–
myosin cortex. Their simulations took into account cell proliferation alongside their
reshaping.
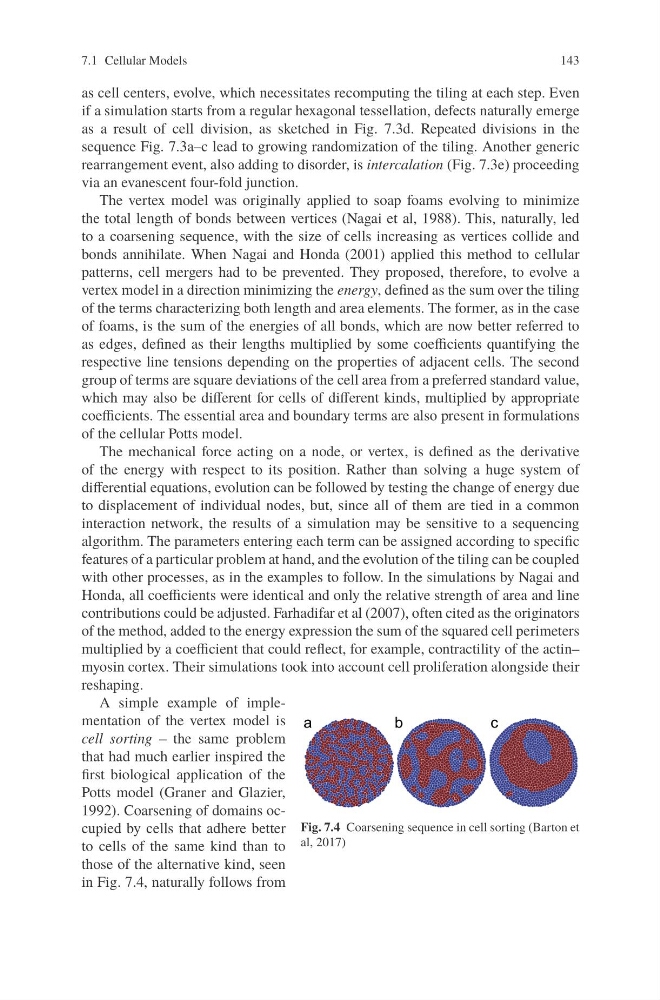
Fig. 7.4 Coarsening sequence in cell sorting (Barton et
al, 2017)
A simple example of implementation of the vertex model is
cell sorting – the same problem
that had much earlier inspired the
first biological application of the
Potts model (Graner and Glazier,
1992). Coarsening of domains occupied by cells that adhere better
to cells of the same kind than to
those of the alternative kind, seen
in Fig. 7.4, naturally follows from
143
as cell centers, evolve, which necessitates recomputing the tiling at each step. Even
if a simulation starts from a regular hexagonal tessellation, defects naturally emerge
as a result of cell division, as sketched in Fig. 7.3d. Repeated divisions in the
sequence Fig. 7.3a–c lead to growing randomization of the tiling. Another generic
rearrangement event, also adding to disorder, is intercalation (Fig. 7.3e) proceeding
via an evanescent four-fold junction.
The vertex model was originally applied to soap foams evolving to minimize
the total length of bonds between vertices (Nagai et al, 1988). This, naturally, led
to a coarsening sequence, with the size of cells increasing as vertices collide and
bonds annihilate. When Nagai and Honda (2001) applied this method to cellular
patterns, cell mergers had to be prevented. They proposed, therefore, to evolve a
vertex model in a direction minimizing the energy, defined as the sum over the tiling
of the terms characterizing both length and area elements. The former, as in the case
of foams, is the sum of the energies of all bonds, which are now better referred to
as edges, defined as their lengths multiplied by some coefficients quantifying the
respective line tensions depending on the properties of adjacent cells. The second
group of terms are square deviations of the cell area from a preferred standard value,
which may also be different for cells of different kinds, multiplied by appropriate
coefficients. The essential area and boundary terms are also present in formulations
of the cellular Potts model.
The mechanical force acting on a node, or vertex, is defined as the derivative
of the energy with respect to its position. Rather than solving a huge system of
differential equations, evolution can be followed by testing the change of energy due
to displacement of individual nodes, but, since all of them are tied in a common
interaction network, the results of a simulation may be sensitive to a sequencing
algorithm. The parameters entering each term can be assigned according to specific
features of a particular problem at hand, and the evolution of the tiling can be coupled
with other processes, as in the examples to follow. In the simulations by Nagai and
Honda, all coefficients were identical and only the relative strength of area and line
contributions could be adjusted. Farhadifar et al (2007), often cited as the originators
of the method, added to the energy expression the sum of the squared cell perimeters
multiplied by a coefficient that could reflect, for example, contractility of the actin–
myosin cortex. Their simulations took into account cell proliferation alongside their
reshaping.
Fig. 7.4 Coarsening sequence in cell sorting (Barton et
al, 2017)
A simple example of implementation of the vertex model is
cell sorting – the same problem
that had much earlier inspired the
first biological application of the
Potts model (Graner and Glazier,
1992). Coarsening of domains occupied by cells that adhere better
to cells of the same kind than to
those of the alternative kind, seen
in Fig. 7.4, naturally follows from