

132
6 Active Gels
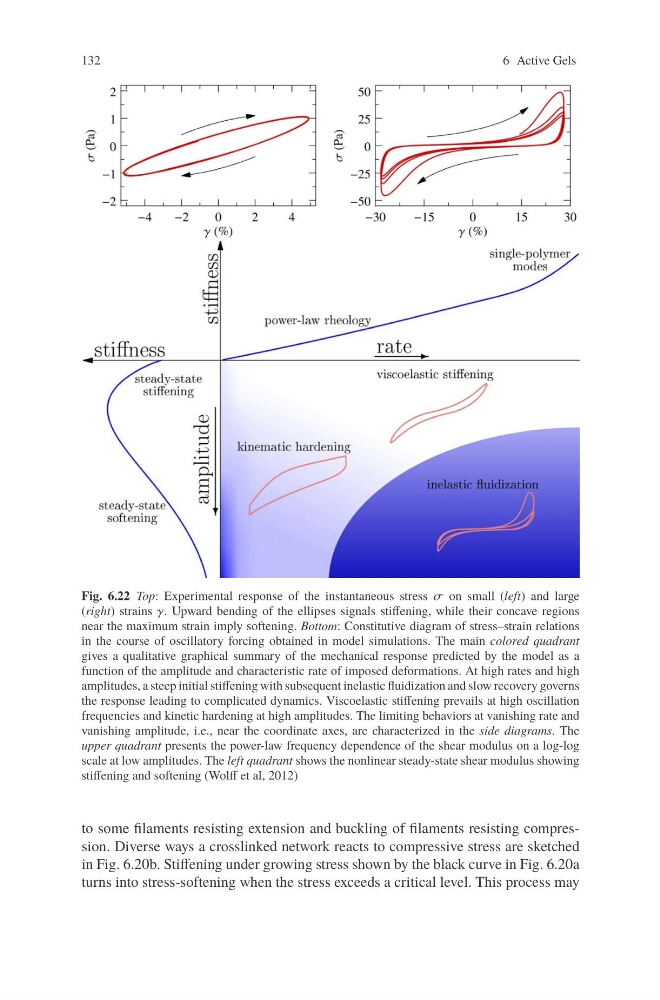
Fig. 6.22 Top: Experimental response of the instantaneous stress σ on small (left) and large
(right) strains γ. Upward bending of the ellipses signals stiffening, while their concave regions
near the maximum strain imply softening. Bottom: Constitutive diagram of stress–strain relations
in the course of oscillatory forcing obtained in model simulations. The main colored quadrant
gives a qualitative graphical summary of the mechanical response predicted by the model as a
function of the amplitude and characteristic rate of imposed deformations. At high rates and high
amplitudes, a steep initial stiffening with subsequent inelastic fluidization and slow recovery governs
the response leading to complicated dynamics. Viscoelastic stiffening prevails at high oscillation
frequencies and kinetic hardening at high amplitudes. The limiting behaviors at vanishing rate and
vanishing amplitude, i.e., near the coordinate axes, are characterized in the side diagrams. The
upper quadrant presents the power-law frequency dependence of the shear modulus on a log-log
scale at low amplitudes. The left quadrant shows the nonlinear steady-state shear modulus showing
stiffening and softening (Wolff et al, 2012)
to some filaments resisting extension and buckling of filaments resisting compression. Diverse ways a crosslinked network reacts to compressive stress are sketched
in Fig. 6.20b. Stiffening under growing stress shown by the black curve in Fig. 6.20a
turns into stress-softening when the stress exceeds a critical level. This process may
6 Active Gels
Fig. 6.22 Top: Experimental response of the instantaneous stress σ on small (left) and large
(right) strains γ. Upward bending of the ellipses signals stiffening, while their concave regions
near the maximum strain imply softening. Bottom: Constitutive diagram of stress–strain relations
in the course of oscillatory forcing obtained in model simulations. The main colored quadrant
gives a qualitative graphical summary of the mechanical response predicted by the model as a
function of the amplitude and characteristic rate of imposed deformations. At high rates and high
amplitudes, a steep initial stiffening with subsequent inelastic fluidization and slow recovery governs
the response leading to complicated dynamics. Viscoelastic stiffening prevails at high oscillation
frequencies and kinetic hardening at high amplitudes. The limiting behaviors at vanishing rate and
vanishing amplitude, i.e., near the coordinate axes, are characterized in the side diagrams. The
upper quadrant presents the power-law frequency dependence of the shear modulus on a log-log
scale at low amplitudes. The left quadrant shows the nonlinear steady-state shear modulus showing
stiffening and softening (Wolff et al, 2012)
to some filaments resisting extension and buckling of filaments resisting compression. Diverse ways a crosslinked network reacts to compressive stress are sketched
in Fig. 6.20b. Stiffening under growing stress shown by the black curve in Fig. 6.20a
turns into stress-softening when the stress exceeds a critical level. This process may