

6.5 Modeling Tissues
129
A coeval model by Lee and Wolgemuth (2011) did include the Stokes equation
of a viscous fluid, nematic elasticity, and the tensile active force along the nematic
director, but assumed the cell density to be constant. The free boundary of the layer
advanced to close a circular wound or to distort a rectangular layer, as shown in
Fig. 6.17a. Save for the meaning of the arrows and coloration, this picture looks very
much like Fig. 6.17b, originating from a totally different model.
Köpf and Pismen (2013b) considered an elastic rather than viscous layer, and as in
the scheme in Fig. 6.14a, included interactions among three fields: vector polarization, deformation, and a chemical signal. However, this triad interacted in a different
way: advance along the polarization direction was proportional to the concentration
of a chemical, which also enhanced polarization. This feature was grounded in experiments by Nikolić et al (2006) showing that injury-induced activation of a signaling
species is essential for collective cell migration after wounding. On the other hand,
Poujade et al (2007) observed expansion of a layer into unoccupied space with no
injury, although this did not mean that chemical signaling was absent.
The model faithfully reproduced the essential features of unconstrained spreading
observed by Poujade et al, including fingering, swirling motion, as in Fig. 6.17b, and
a faster advance near the leading edge. Fingering is a ubiquitous feature of spreading
layers that can be attributed just to the enlargement of the contour of the advancing
free boundary in protruding regions. This basic factor operates in the model by Lee
and Wolgemuth (2011), while in the model currently discussed it is enhanced by
higher chemical activity in expanded areas. The computation used a Lagrangian
algorithm, whereby points on the original grid advanced with the local velocity. If
each point in the Lagrangian grid corresponds to a cell, this means that cells in more
strongly polarized and faster moving areas grow larger, as seen in Fig. 6.17b, and
can be identified with enlarged leader cells observed in protruding fingers. Later
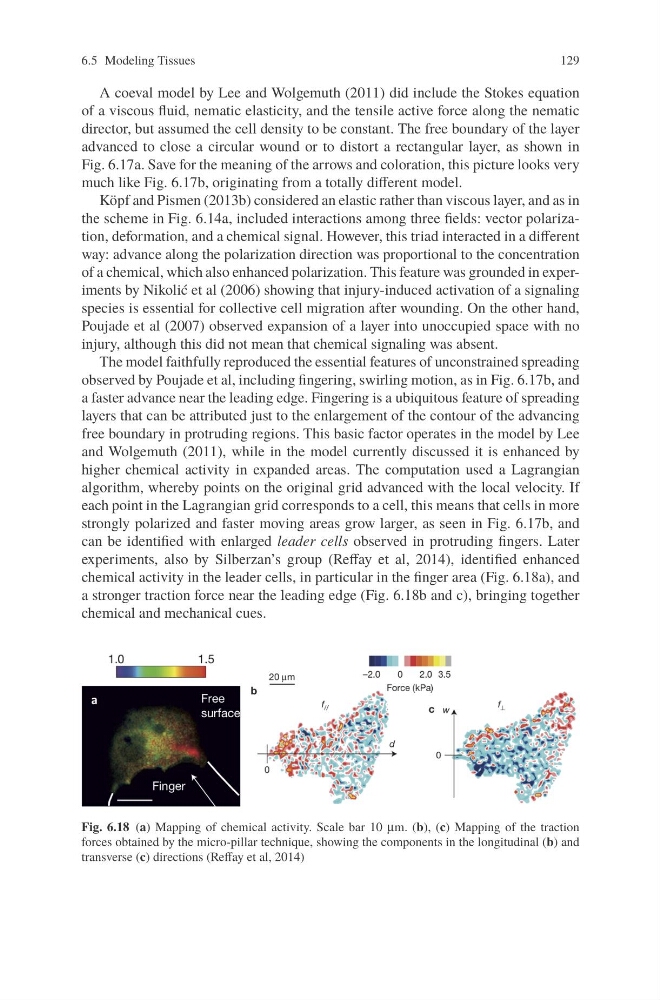
experiments, also by Silberzan’s group (Reffay et al, 2014), identified enhanced
chemical activity in the leader cells, in particular in the finger area (Fig. 6.18a), and
a stronger traction force near the leading edge (Fig. 6.18b and c), bringing together
chemical and mechanical cues.
Fig. 6.18 (a) Mapping of chemical activity. Scale bar 10 μm. (b), (c) Mapping of the traction
forces obtained by the micro-pillar technique, showing the components in the longitudinal (b) and
transverse (c) directions (Reffay et al, 2014)
129
A coeval model by Lee and Wolgemuth (2011) did include the Stokes equation
of a viscous fluid, nematic elasticity, and the tensile active force along the nematic
director, but assumed the cell density to be constant. The free boundary of the layer
advanced to close a circular wound or to distort a rectangular layer, as shown in
Fig. 6.17a. Save for the meaning of the arrows and coloration, this picture looks very
much like Fig. 6.17b, originating from a totally different model.
Köpf and Pismen (2013b) considered an elastic rather than viscous layer, and as in
the scheme in Fig. 6.14a, included interactions among three fields: vector polarization, deformation, and a chemical signal. However, this triad interacted in a different
way: advance along the polarization direction was proportional to the concentration
of a chemical, which also enhanced polarization. This feature was grounded in experiments by Nikolić et al (2006) showing that injury-induced activation of a signaling
species is essential for collective cell migration after wounding. On the other hand,
Poujade et al (2007) observed expansion of a layer into unoccupied space with no
injury, although this did not mean that chemical signaling was absent.
The model faithfully reproduced the essential features of unconstrained spreading
observed by Poujade et al, including fingering, swirling motion, as in Fig. 6.17b, and
a faster advance near the leading edge. Fingering is a ubiquitous feature of spreading
layers that can be attributed just to the enlargement of the contour of the advancing
free boundary in protruding regions. This basic factor operates in the model by Lee
and Wolgemuth (2011), while in the model currently discussed it is enhanced by
higher chemical activity in expanded areas. The computation used a Lagrangian
algorithm, whereby points on the original grid advanced with the local velocity. If
each point in the Lagrangian grid corresponds to a cell, this means that cells in more
strongly polarized and faster moving areas grow larger, as seen in Fig. 6.17b, and
can be identified with enlarged leader cells observed in protruding fingers. Later
experiments, also by Silberzan’s group (Reffay et al, 2014), identified enhanced
chemical activity in the leader cells, in particular in the finger area (Fig. 6.18a), and
a stronger traction force near the leading edge (Fig. 6.18b and c), bringing together
chemical and mechanical cues.
Fig. 6.18 (a) Mapping of chemical activity. Scale bar 10 μm. (b), (c) Mapping of the traction
forces obtained by the micro-pillar technique, showing the components in the longitudinal (b) and
transverse (c) directions (Reffay et al, 2014)