

5.4 Filaments in Vitro
99
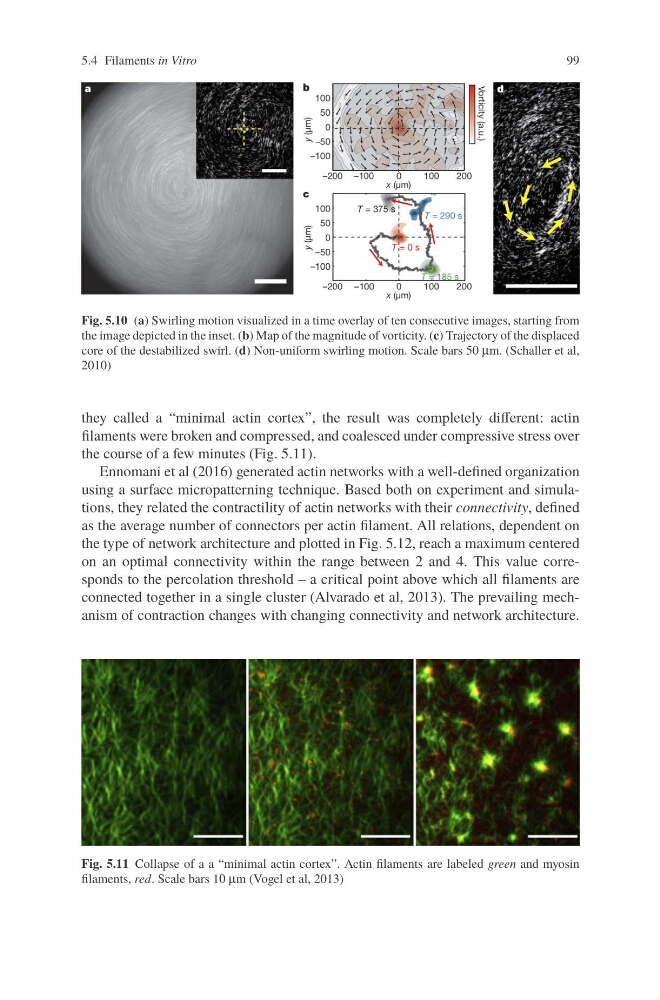
Fig. 5.10 (a) Swirling motion visualized in a time overlay of ten consecutive images, starting from
the image depicted in the inset. (b) Map of the magnitude of vorticity. (c) Trajectory of the displaced
core of the destabilized swirl. (d) Non-uniform swirling motion. Scale bars 50 μm. (Schaller et al,
2010)
they called a “minimal actin cortex”, the result was completely different: actin
filaments were broken and compressed, and coalesced under compressive stress over
the course of a few minutes (Fig. 5.11).
Ennomani et al (2016) generated actin networks with a well-defined organization
using a surface micropatterning technique. Based both on experiment and simulations, they related the contractility of actin networks with their connectivity, defined
as the average number of connectors per actin filament. All relations, dependent on
the type of network architecture and plotted in Fig. 5.12, reach a maximum centered
on an optimal connectivity within the range between 2 and 4. This value corresponds to the percolation threshold – a critical point above which all filaments are
connected together in a single cluster (Alvarado et al, 2013). The prevailing mechanism of contraction changes with changing connectivity and network architecture.
Fig. 5.11 Collapse of a a “minimal actin cortex”. Actin filaments are labeled green and myosin
filaments, red. Scale bars 10 μm (Vogel et al, 2013)
99
Fig. 5.10 (a) Swirling motion visualized in a time overlay of ten consecutive images, starting from
the image depicted in the inset. (b) Map of the magnitude of vorticity. (c) Trajectory of the displaced
core of the destabilized swirl. (d) Non-uniform swirling motion. Scale bars 50 μm. (Schaller et al,
2010)
they called a “minimal actin cortex”, the result was completely different: actin
filaments were broken and compressed, and coalesced under compressive stress over
the course of a few minutes (Fig. 5.11).
Ennomani et al (2016) generated actin networks with a well-defined organization
using a surface micropatterning technique. Based both on experiment and simulations, they related the contractility of actin networks with their connectivity, defined
as the average number of connectors per actin filament. All relations, dependent on
the type of network architecture and plotted in Fig. 5.12, reach a maximum centered
on an optimal connectivity within the range between 2 and 4. This value corresponds to the percolation threshold – a critical point above which all filaments are
connected together in a single cluster (Alvarado et al, 2013). The prevailing mechanism of contraction changes with changing connectivity and network architecture.
Fig. 5.11 Collapse of a a “minimal actin cortex”. Actin filaments are labeled green and myosin
filaments, red. Scale bars 10 μm (Vogel et al, 2013)