

22.4.2 Analysis of Discrete Emissions from Gas-Discharge
Lamps in “Optical Goniometer Mode”
The LUCEGRAFO system could be placed on a rotating base (Fig. 22.3, right)
making it more similar to an optical goniometer in which the dispersive element is
fixed at the center of rotation of the basis (not more fixed in front of the webcam lens)
and the sensor revolves circularly around it. Different portions of the spectra are thus
observed if the sensor forms an angle α (the angular scale has a sensibility of 1
) with
respect to the direction of symmetry (perpendicular to the grating). At various orders
m, the wavelength corresponding at a specific angle could be evaluated with the
grating’s formula, quoted above, reading the angle on the angular scale (a fixed
vertical marker appears on the digital image as a reference to target the position). No
calibration phase is required in this modality, except the operation of making the
0
angle with the position of the source (zeroth order). The advantage of having this
second measurement modality available is that students can appreciate the angular
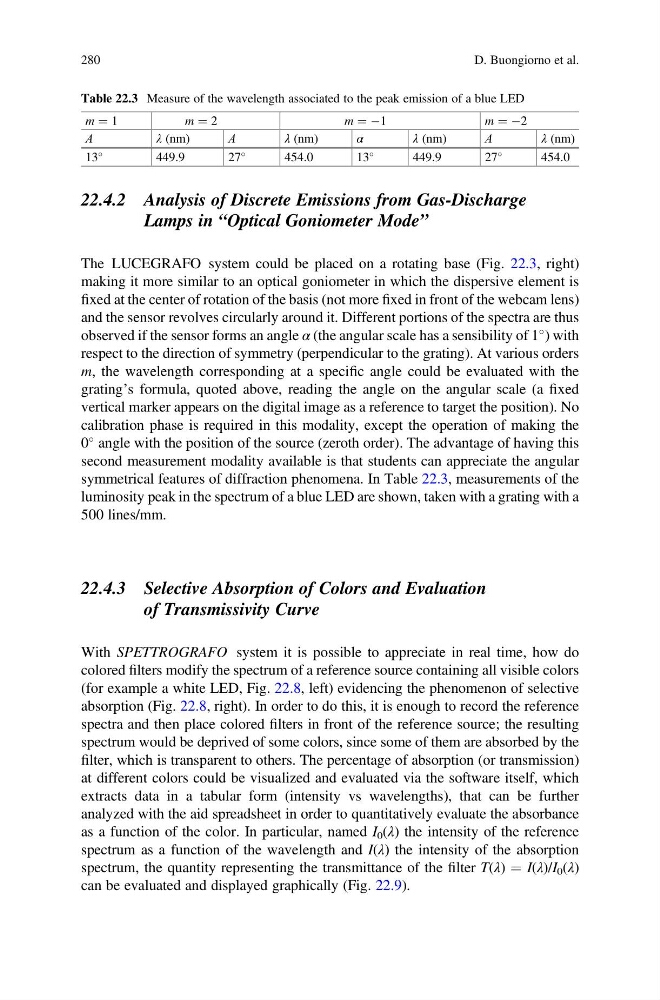
symmetrical features of diffraction phenomena. In Table 22.3, measurements of the
luminosity peak in the spectrum of a blue LED are shown, taken with a grating with a
500 lines/mm.
22.4.3 Selective Absorption of Colors and Evaluation
of Transmissivity Curve
With SPETTROGRAFO system it is possible to appreciate in real time, how do
colored filters modify the spectrum of a reference source containing all visible colors
(for example a white LED, Fig. 22.8, left) evidencing the phenomenon of selective
absorption (Fig. 22.8, right). In order to do this, it is enough to record the reference
spectra and then place colored filters in front of the reference source; the resulting
spectrum would be deprived of some colors, since some of them are absorbed by the
filter, which is transparent to others. The percentage of absorption (or transmission)
at different colors could be visualized and evaluated via the software itself, which
extracts data in a tabular form (intensity vs wavelengths), that can be further
analyzed with the aid spreadsheet in order to quantitatively evaluate the absorbance
as a function of the color. In particular, named I 0 (λ) the intensity of the reference
spectrum as a function of the wavelength and I(λ) the intensity of the absorption
spectrum, the quantity representing the transmittance of the filter T(λ) ¼ I(λ)/I 0 (λ)
can be evaluated and displayed graphically (Fig. 22.9).
Table 22.3 Measure of the wavelength associated to the peak emission of a blue LED
m ¼ 1
m ¼ 2
m ¼ À1
m ¼ À2
Α
λ (nm)
Α
λ (nm)
α
λ(nm)
Α
λ (nm)
13
449.9
27
454.0
13
449.9
27
454.0
280
D. Buongiorno et al.
Lamps in “Optical Goniometer Mode”
The LUCEGRAFO system could be placed on a rotating base (Fig. 22.3, right)
making it more similar to an optical goniometer in which the dispersive element is
fixed at the center of rotation of the basis (not more fixed in front of the webcam lens)
and the sensor revolves circularly around it. Different portions of the spectra are thus
observed if the sensor forms an angle α (the angular scale has a sensibility of 1
) with
respect to the direction of symmetry (perpendicular to the grating). At various orders
m, the wavelength corresponding at a specific angle could be evaluated with the
grating’s formula, quoted above, reading the angle on the angular scale (a fixed
vertical marker appears on the digital image as a reference to target the position). No
calibration phase is required in this modality, except the operation of making the
0
angle with the position of the source (zeroth order). The advantage of having this
second measurement modality available is that students can appreciate the angular
symmetrical features of diffraction phenomena. In Table 22.3, measurements of the
luminosity peak in the spectrum of a blue LED are shown, taken with a grating with a
500 lines/mm.
22.4.3 Selective Absorption of Colors and Evaluation
of Transmissivity Curve
With SPETTROGRAFO system it is possible to appreciate in real time, how do
colored filters modify the spectrum of a reference source containing all visible colors
(for example a white LED, Fig. 22.8, left) evidencing the phenomenon of selective
absorption (Fig. 22.8, right). In order to do this, it is enough to record the reference
spectra and then place colored filters in front of the reference source; the resulting
spectrum would be deprived of some colors, since some of them are absorbed by the
filter, which is transparent to others. The percentage of absorption (or transmission)
at different colors could be visualized and evaluated via the software itself, which
extracts data in a tabular form (intensity vs wavelengths), that can be further
analyzed with the aid spreadsheet in order to quantitatively evaluate the absorbance
as a function of the color. In particular, named I 0 (λ) the intensity of the reference
spectrum as a function of the wavelength and I(λ) the intensity of the absorption
spectrum, the quantity representing the transmittance of the filter T(λ) ¼ I(λ)/I 0 (λ)
can be evaluated and displayed graphically (Fig. 22.9).
Table 22.3 Measure of the wavelength associated to the peak emission of a blue LED
m ¼ 1
m ¼ 2
m ¼ À1
m ¼ À2
Α
λ (nm)
Α
λ (nm)
α
λ(nm)
Α
λ (nm)
13
449.9
27
454.0
13
449.9
27
454.0
280
D. Buongiorno et al.