

instruments changes: in particular doubling the pitch, the resolving power decreases
of a factor two, and some lines can merge together and be no more angularly
separated. As an example, some visible emissions in cadmium and helium spectra
have been measured and they are reported in Table 22.2, compared with standard
values obtained from official databases.
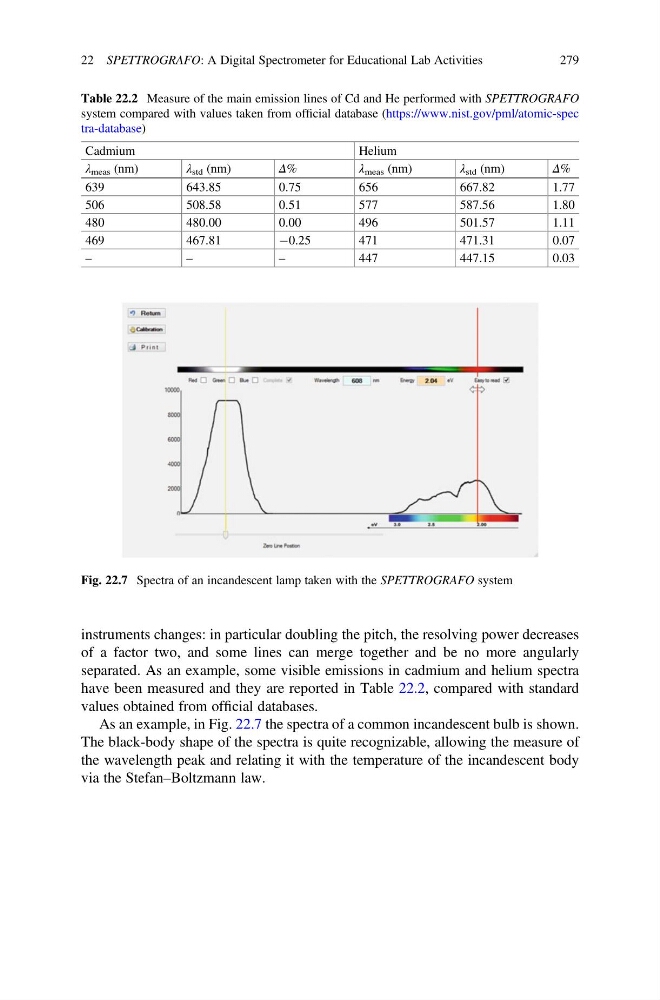
As an example, in Fig. 22.7 the spectra of a common incandescent bulb is shown.
The black-body shape of the spectra is quite recognizable, allowing the measure of
the wavelength peak and relating it with the temperature of the incandescent body
via the Stefan–Boltzmann law.
Table 22.2 Measure of the main emission lines of Cd and He performed with SPETTROGRAFO
system compared with values taken from official database (https://www.nist.gov/pml/atomic-spec
tra-database)
Cadmium
Helium
λ meas (nm)
λ std (nm)
Δ%
λ meas (nm)
λ std (nm)
Δ%
639
643.85
0.75
656
667.82
1.77
506
508.58
0.51
577
587.56
1.80
480
480.00
0.00
496
501.57
1.11
469
467.81
À0.25
471
471.31
0.07
–
–
–
447
447.15
0.03
Fig. 22.7 Spectra of an incandescent lamp taken with the SPETTROGRAFO system
22 SPETTROGRAFO: A Digital Spectrometer for Educational Lab Activities
279
of a factor two, and some lines can merge together and be no more angularly
separated. As an example, some visible emissions in cadmium and helium spectra
have been measured and they are reported in Table 22.2, compared with standard
values obtained from official databases.
As an example, in Fig. 22.7 the spectra of a common incandescent bulb is shown.
The black-body shape of the spectra is quite recognizable, allowing the measure of
the wavelength peak and relating it with the temperature of the incandescent body
via the Stefan–Boltzmann law.
Table 22.2 Measure of the main emission lines of Cd and He performed with SPETTROGRAFO
system compared with values taken from official database (https://www.nist.gov/pml/atomic-spec
tra-database)
Cadmium
Helium
λ meas (nm)
λ std (nm)
Δ%
λ meas (nm)
λ std (nm)
Δ%
639
643.85
0.75
656
667.82
1.77
506
508.58
0.51
577
587.56
1.80
480
480.00
0.00
496
501.57
1.11
469
467.81
À0.25
471
471.31
0.07
–
–
–
447
447.15
0.03
Fig. 22.7 Spectra of an incandescent lamp taken with the SPETTROGRAFO system
22 SPETTROGRAFO: A Digital Spectrometer for Educational Lab Activities
279