

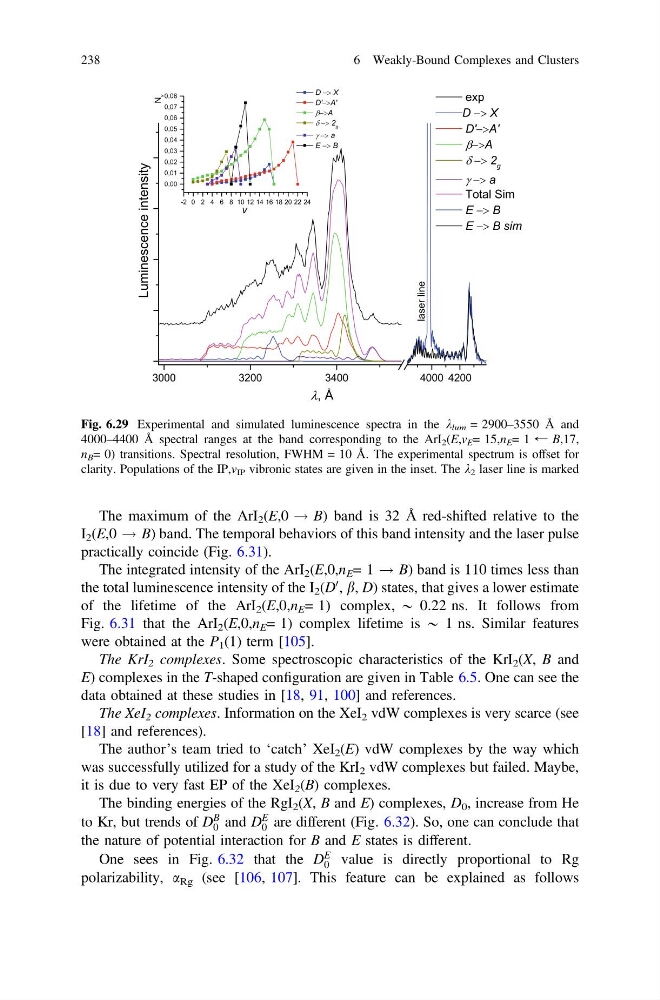
The maximum of the ArI 2 (E,0 ! B) band is 32 Å red-shifted relative to the
I 2 (E,0 ! B) band. The temporal behaviors of this band intensity and the laser pulse
practically coincide (Fig. 6.31).
The integrated intensity of the ArI 2 (E,0,n E = 1 ! B) band is 110 times less than
the total luminescence intensity of the I 2 (D
0 , b, D) states, that gives a lower estimate
of the lifetime of the ArI 2 (E,0,n E = 1) complex, * 0.22 ns. It follows from
Fig. 6.31 that the ArI 2 (E,0,n E = 1) complex lifetime is * 1 ns. Similar features
were obtained at the P 1 (1) term [105].
The KrI 2 complexes. Some spectroscopic characteristics of the KrI 2 (X, B and
E) complexes in the T-shaped configuration are given in Table 6.5. One can see the
data obtained at these studies in [18, 91, 100] and references.
The XeI 2 complexes. Information on the XeI 2 vdW complexes is very scarce (see
[18] and references).
The author’s team tried to ‘catch’ XeI 2 (E) vdW complexes by the way which
was successfully utilized for a study of the KrI 2 vdW complexes but failed. Maybe,
it is due to very fast EP of the XeI 2 (B) complexes.
The binding energies of the RgI 2 (X, B and E) complexes, D 0 , increase from He
to Kr, but trends of D
B
0 and D
E
0 are different (Fig. 6.32). So, one can conclude that
the nature of potential interaction for B and E states is different.
One sees in Fig. 6.32 that the D
E
0 value is directly proportional to Rg
polarizability, a Rg (see [106, 107]. This feature can be explained as follows
Fig. 6.29 Experimental and simulated luminescence spectra in the k lum = 2900–3550 Å and
4000–4400 Å spectral ranges at the band corresponding to the ArI 2 (E,v E = 15,n E = 1 ← B,17,
n B = 0) transitions. Spectral resolution, FWHM = 10 Å. The experimental spectrum is offset for
clarity. Populations of the IP,v IP vibronic states are given in the inset. The k 2 laser line is marked
238
6 Weakly-Bound Complexes and Clusters
I 2 (E,0 ! B) band. The temporal behaviors of this band intensity and the laser pulse
practically coincide (Fig. 6.31).
The integrated intensity of the ArI 2 (E,0,n E = 1 ! B) band is 110 times less than
the total luminescence intensity of the I 2 (D
0 , b, D) states, that gives a lower estimate
of the lifetime of the ArI 2 (E,0,n E = 1) complex, * 0.22 ns. It follows from
Fig. 6.31 that the ArI 2 (E,0,n E = 1) complex lifetime is * 1 ns. Similar features
were obtained at the P 1 (1) term [105].
The KrI 2 complexes. Some spectroscopic characteristics of the KrI 2 (X, B and
E) complexes in the T-shaped configuration are given in Table 6.5. One can see the
data obtained at these studies in [18, 91, 100] and references.
The XeI 2 complexes. Information on the XeI 2 vdW complexes is very scarce (see
[18] and references).
The author’s team tried to ‘catch’ XeI 2 (E) vdW complexes by the way which
was successfully utilized for a study of the KrI 2 vdW complexes but failed. Maybe,
it is due to very fast EP of the XeI 2 (B) complexes.
The binding energies of the RgI 2 (X, B and E) complexes, D 0 , increase from He
to Kr, but trends of D
B
0 and D
E
0 are different (Fig. 6.32). So, one can conclude that
the nature of potential interaction for B and E states is different.
One sees in Fig. 6.32 that the D
E
0 value is directly proportional to Rg
polarizability, a Rg (see [106, 107]. This feature can be explained as follows
Fig. 6.29 Experimental and simulated luminescence spectra in the k lum = 2900–3550 Å and
4000–4400 Å spectral ranges at the band corresponding to the ArI 2 (E,v E = 15,n E = 1 ← B,17,
n B = 0) transitions. Spectral resolution, FWHM = 10 Å. The experimental spectrum is offset for
clarity. Populations of the IP,v IP vibronic states are given in the inset. The k 2 laser line is marked
238
6 Weakly-Bound Complexes and Clusters