

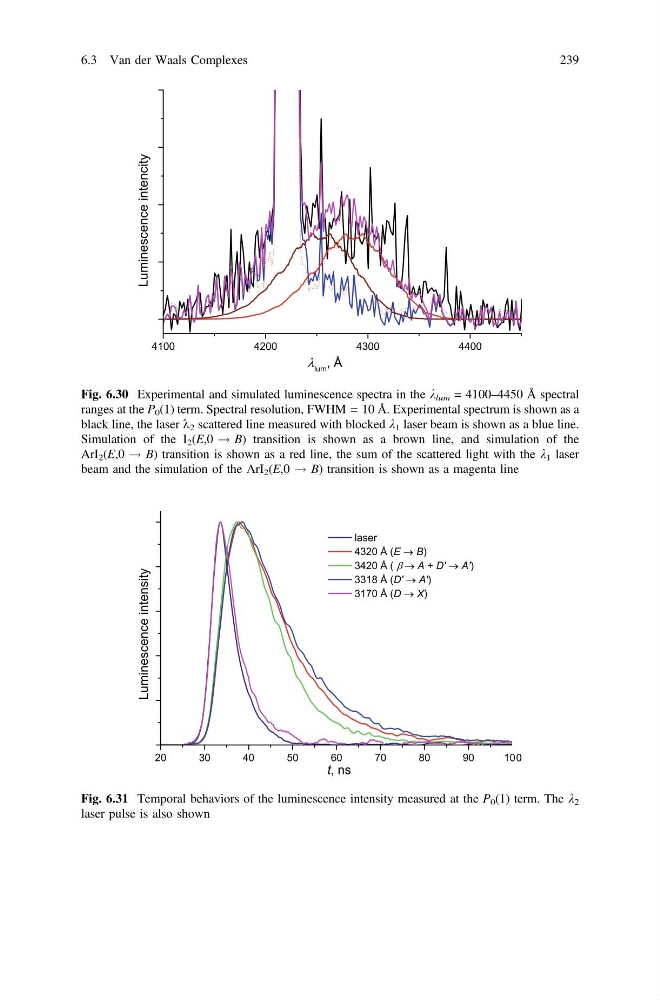
Fig. 6.30 Experimental and simulated luminescence spectra in the k lum = 4100–4450 Å spectral
ranges at the P 0 (1) term. Spectral resolution, FWHM = 10 Å. Experimental spectrum is shown as a
black line, the laser k 2 scattered line measured with blocked k 1 laser beam is shown as a blue line.
Simulation of the I 2 (E,0 ! B) transition is shown as a brown line, and simulation of the
ArI 2 (E,0 ! B) transition is shown as a red line, the sum of the scattered light with the k 1 laser
beam and the simulation of the ArI 2 (E,0 ! B) transition is shown as a magenta line
Fig. 6.31 Temporal behaviors of the luminescence intensity measured at the P 0 (1) term. The k 2
laser pulse is also shown
6.3 Van der Waals Complexes
239
ranges at the P 0 (1) term. Spectral resolution, FWHM = 10 Å. Experimental spectrum is shown as a
black line, the laser k 2 scattered line measured with blocked k 1 laser beam is shown as a blue line.
Simulation of the I 2 (E,0 ! B) transition is shown as a brown line, and simulation of the
ArI 2 (E,0 ! B) transition is shown as a red line, the sum of the scattered light with the k 1 laser
beam and the simulation of the ArI 2 (E,0 ! B) transition is shown as a magenta line
Fig. 6.31 Temporal behaviors of the luminescence intensity measured at the P 0 (1) term. The k 2
laser pulse is also shown
6.3 Van der Waals Complexes
239