

There is a non-adiabatic transition from the bound ArI 2 (E) PES to the repulsive part
of the ArI 2 (IP) PESs, and then the image point slides down to the pelvis of the
Ar þ I 2 IP; v IP ¼ v
max
IP À 0
À
Á
dissociation channel, and the I 2 IP; v IP ¼ v
max
IP À v
min
IP
À
Á
vibronic states are populated.
Luminescence of the ArI 2 (E,v E ,n E ) complexes. In the I 2 (E ! B) transition
spectral range, the luminescence band corresponding to the ArI 2 (E,0 ! B) transition is observed [105] (see Fig. 6.30).
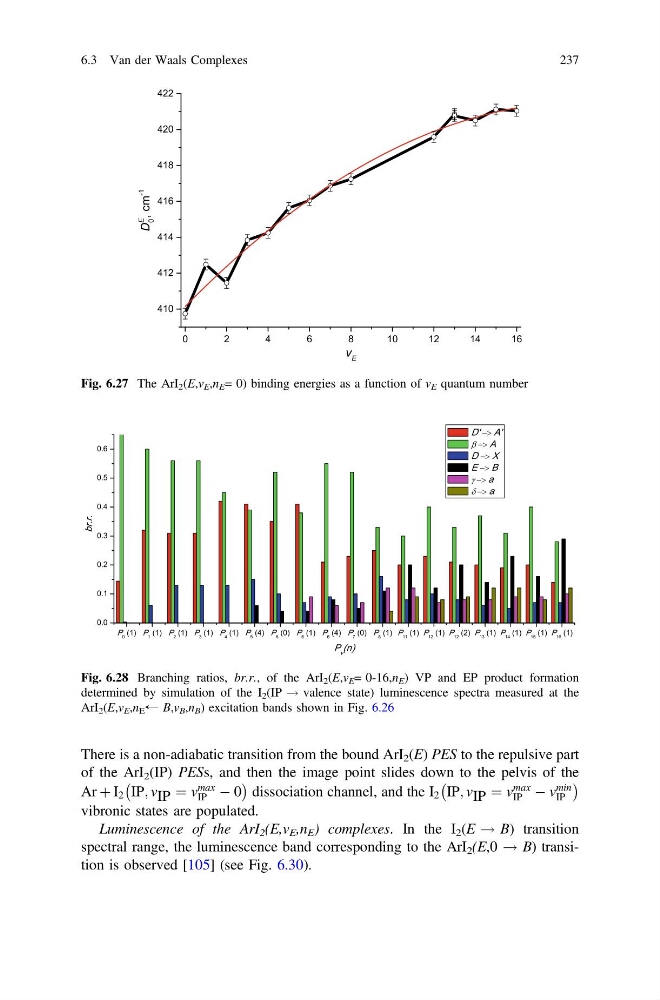
Fig. 6.27 The ArI 2 (E,v E ,n E = 0) binding energies as a function of v E quantum number
Fig. 6.28 Branching ratios, br.r., of the ArI 2 (E,v E = 0-16,n E ) VP and EP product formation
determined by simulation of the I 2 (IP ! valence state) luminescence spectra measured at the
ArI 2 (E,v E ,n E ← B,v B ,n B ) excitation bands shown in Fig. 6.26
6.3 Van der Waals Complexes
237
of the ArI 2 (IP) PESs, and then the image point slides down to the pelvis of the
Ar þ I 2 IP; v IP ¼ v
max
IP À 0
À
Á
dissociation channel, and the I 2 IP; v IP ¼ v
max
IP À v
min
IP
À
Á
vibronic states are populated.
Luminescence of the ArI 2 (E,v E ,n E ) complexes. In the I 2 (E ! B) transition
spectral range, the luminescence band corresponding to the ArI 2 (E,0 ! B) transition is observed [105] (see Fig. 6.30).
Fig. 6.27 The ArI 2 (E,v E ,n E = 0) binding energies as a function of v E quantum number
Fig. 6.28 Branching ratios, br.r., of the ArI 2 (E,v E = 0-16,n E ) VP and EP product formation
determined by simulation of the I 2 (IP ! valence state) luminescence spectra measured at the
ArI 2 (E,v E ,n E ← B,v B ,n B ) excitation bands shown in Fig. 6.26
6.3 Van der Waals Complexes
237