

FCF with the initial one is mainly populated (Table 5.4). These CINATs are
accompanied by resonant populations of the Cl 2 (X,v X = 1,J X ) rovibronic states:
Cl 2 D; v D; J D
À
Á þ Cl 2 X; v X ¼ 0; J X
ð
Þ!Cl 2 E; v E;J J E
À
Á þ Cl 2 X; v X ¼ 1; J X
ð
Þ ;
ð5:5:34Þ
240
245
250
255
260
E,4
E,6
v X
20
14
1
1
v B
v B
v X
D,4
D,6
42
45
49
Luminescence intensity
λ, nm
44
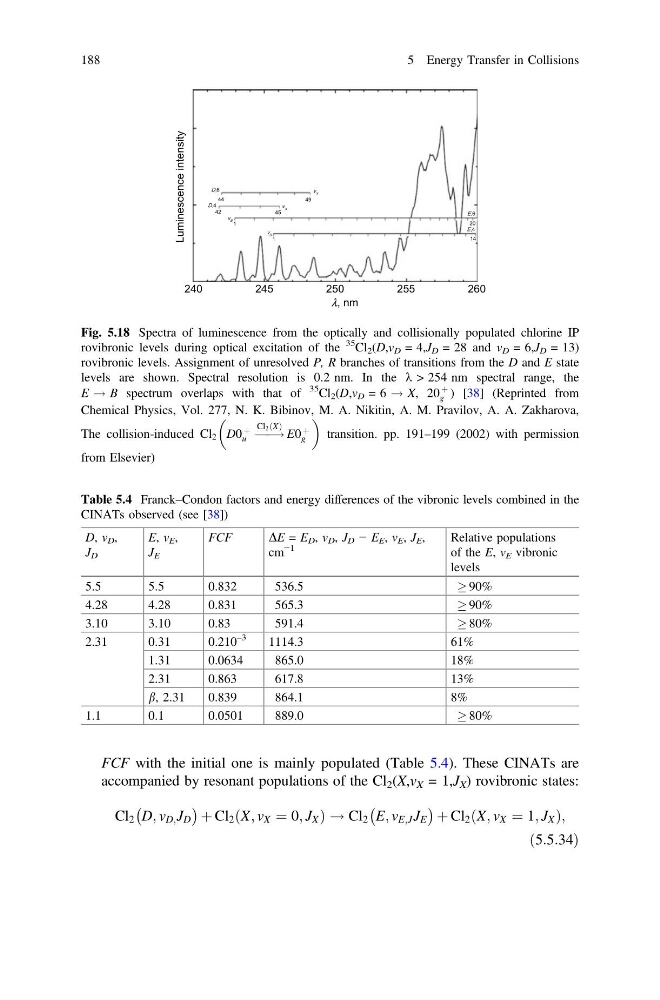
Fig. 5.18 Spectra of luminescence from the optically and collisionally populated chlorine IP
rovibronic levels during optical excitation of the
35
Cl 2 (D,v D = 4,J D = 28 and v D = 6,J D = 13)
rovibronic levels. Assignment of unresolved P, R branches of transitions from the D and E state
levels are shown. Spectral resolution is 0.2 nm. In the k > 254 nm spectral range, the
E ! B spectrum overlaps with that of
35
Cl 2 (D,v D = 6 ! X, 20
þ
g ) [38] (Reprinted from
Chemical Physics, Vol. 277, N. K. Bibinov, M. A. Nikitin, A. M. Pravilov, A. A. Zakharova,
The collision-induced Cl 2 D0
þ
u !
Cl2ðXÞ
E0
þ
g
transition. pp. 191–199 (2002) with permission
from Elsevier)
Table 5.4 Franck–Condon factors and energy differences of the vibronic levels combined in the
CINATs observed (see [38])
D, v D ,
J D
E, v E ,
J E
FCF
DE = E D , v D , J D − E E , v E , J E ,
cm
−1
Relative populations
of the E, v E vibronic
levels
5.5
5.5
0.832
536.5
! 90%
4.28
4.28
0.831
565.3
! 90%
3.10
3.10
0.83
591.4
! 80%
2.31
0.31
0.210
–3
1114.3
61%
1.31
0.0634
865.0
18%
2.31
0.863
617.8
13%
b, 2.31
0.839
864.1
8%
1.1
0.1
0.0501
889.0
! 80%
188
5 Energy Transfer in Collisions
accompanied by resonant populations of the Cl 2 (X,v X = 1,J X ) rovibronic states:
Cl 2 D; v D; J D
À
Á þ Cl 2 X; v X ¼ 0; J X
ð
Þ!Cl 2 E; v E;J J E
À
Á þ Cl 2 X; v X ¼ 1; J X
ð
Þ ;
ð5:5:34Þ
240
245
250
255
260
E,4
E,6
v X
20
14
1
1
v B
v B
v X
D,4
D,6
42
45
49
Luminescence intensity
λ, nm
44
Fig. 5.18 Spectra of luminescence from the optically and collisionally populated chlorine IP
rovibronic levels during optical excitation of the
35
Cl 2 (D,v D = 4,J D = 28 and v D = 6,J D = 13)
rovibronic levels. Assignment of unresolved P, R branches of transitions from the D and E state
levels are shown. Spectral resolution is 0.2 nm. In the k > 254 nm spectral range, the
E ! B spectrum overlaps with that of
35
Cl 2 (D,v D = 6 ! X, 20
þ
g ) [38] (Reprinted from
Chemical Physics, Vol. 277, N. K. Bibinov, M. A. Nikitin, A. M. Pravilov, A. A. Zakharova,
The collision-induced Cl 2 D0
þ
u !
Cl2ðXÞ
E0
þ
g
transition. pp. 191–199 (2002) with permission
from Elsevier)
Table 5.4 Franck–Condon factors and energy differences of the vibronic levels combined in the
CINATs observed (see [38])
D, v D ,
J D
E, v E ,
J E
FCF
DE = E D , v D , J D − E E , v E , J E ,
cm
−1
Relative populations
of the E, v E vibronic
levels
5.5
5.5
0.832
536.5
! 90%
4.28
4.28
0.831
565.3
! 90%
3.10
3.10
0.83
591.4
! 80%
2.31
0.31
0.210
–3
1114.3
61%
1.31
0.0634
865.0
18%
2.31
0.863
617.8
13%
b, 2.31
0.839
864.1
8%
1.1
0.1
0.0501
889.0
! 80%
188
5 Energy Transfer in Collisions