

346
K. Xiao and C.-X. Wu
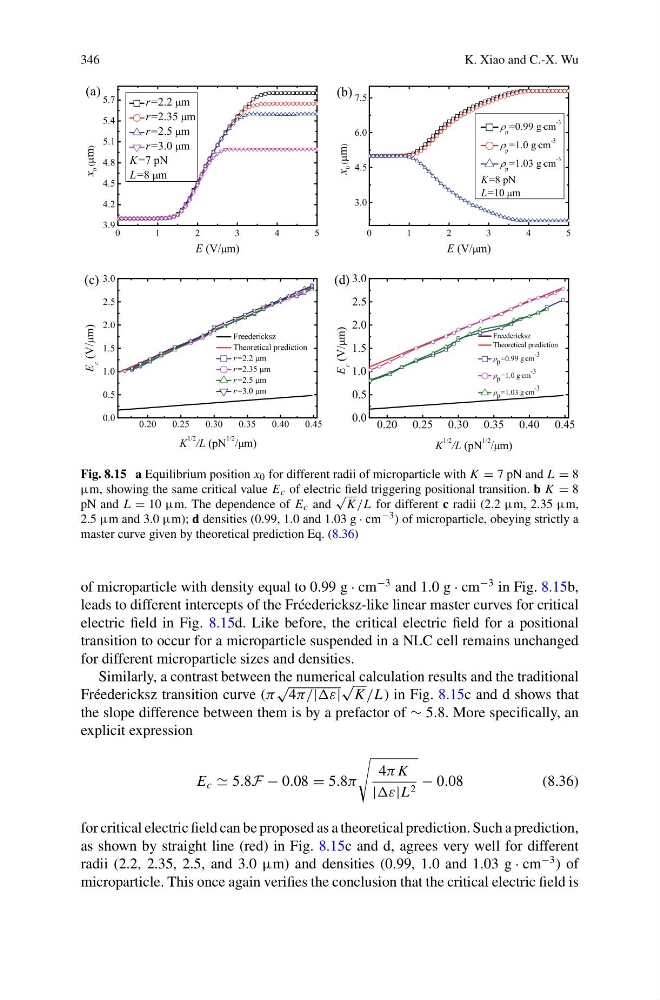
Fig. 8.15 a Equilibrium position x 0 for different radii of microparticle with K = 7 pN and L = 8
µm, showing the same critical value E c of electric field triggering positional transition. b K = 8
pN and L = 10 µm. The dependence of E c and
√
K /L for different c radii (2.2 µm, 2.35 µm,
2.5 µm and 3.0 µm); d densities (0.99, 1.0 and 1.03 g · cm −3 ) of microparticle, obeying strictly a
master curve given by theoretical prediction Eq. (8.36)
of microparticle with density equal to 0.99 g · cm
−3 and 1.0 g · cm
−3 in Fig. 8.15b,
leads to different intercepts of the Fréedericksz-like linear master curves for critical
electric field in Fig. 8.15d. Like before, the critical electric field for a positional
transition to occur for a microparticle suspended in a NLC cell remains unchanged
for different microparticle sizes and densities.
Similarly, a contrast between the numerical calculation results and the traditional
Fréedericksz transition curve (π
√
4π/|
√
K /L) in Fig. 8.15c and d shows that
the slope difference between them is by a prefactor of ∼ 5.8. More specifically, an
explicit expression
E c 5.8F − 0.08 = 5.8π
4π K
| 2 − 0.08
(8.36)
for critical electric field can be proposed as a theoretical prediction. Such a prediction,
as shown by straight line (red) in Fig. 8.15c and d, agrees very well for different
radii (2.2, 2.35, 2.5, and 3.0 µm) and densities (0.99, 1.0 and 1.03 g · cm
−3 ) of
microparticle. This once again verifies the conclusion that the critical electric field is
K. Xiao and C.-X. Wu
Fig. 8.15 a Equilibrium position x 0 for different radii of microparticle with K = 7 pN and L = 8
µm, showing the same critical value E c of electric field triggering positional transition. b K = 8
pN and L = 10 µm. The dependence of E c and
√
K /L for different c radii (2.2 µm, 2.35 µm,
2.5 µm and 3.0 µm); d densities (0.99, 1.0 and 1.03 g · cm −3 ) of microparticle, obeying strictly a
master curve given by theoretical prediction Eq. (8.36)
of microparticle with density equal to 0.99 g · cm
−3 and 1.0 g · cm
−3 in Fig. 8.15b,
leads to different intercepts of the Fréedericksz-like linear master curves for critical
electric field in Fig. 8.15d. Like before, the critical electric field for a positional
transition to occur for a microparticle suspended in a NLC cell remains unchanged
for different microparticle sizes and densities.
Similarly, a contrast between the numerical calculation results and the traditional
Fréedericksz transition curve (π
√
4π/|
√
K /L) in Fig. 8.15c and d shows that
the slope difference between them is by a prefactor of ∼ 5.8. More specifically, an
explicit expression
E c 5.8F − 0.08 = 5.8π
4π K
| 2 − 0.08
(8.36)
for critical electric field can be proposed as a theoretical prediction. Such a prediction,
as shown by straight line (red) in Fig. 8.15c and d, agrees very well for different
radii (2.2, 2.35, 2.5, and 3.0 µm) and densities (0.99, 1.0 and 1.03 g · cm
−3 ) of
microparticle. This once again verifies the conclusion that the critical electric field is