

8 Fréedericksz-Like Positional Transition Triggered by An External Electric Field
345
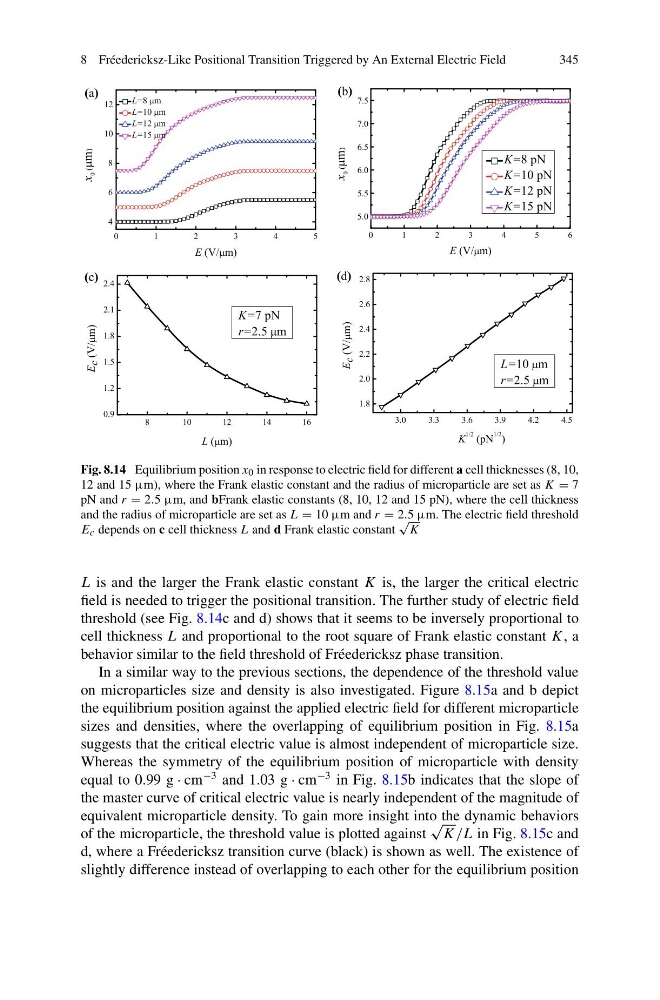
Fig. 8.14 Equilibrium position x 0 in response to electric field for different a cell thicknesses (8, 10,
12 and 15 µm), where the Frank elastic constant and the radius of microparticle are set as K = 7
pN and r = 2.5 µm, and bFrank elastic constants (8, 10, 12 and 15 pN), where the cell thickness
and the radius of microparticle are set as L = 10 µm and r = 2.5 µm. The electric field threshold
E c depends on c cell thickness L and d Frank elastic constant
√
K
L is and the larger the Frank elastic constant K is, the larger the critical electric
field is needed to trigger the positional transition. The further study of electric field
threshold (see Fig. 8.14c and d) shows that it seems to be inversely proportional to
cell thickness L and proportional to the root square of Frank elastic constant K , a
behavior similar to the field threshold of Fréedericksz phase transition.
In a similar way to the previous sections, the dependence of the threshold value
on microparticles size and density is also investigated. Figure 8.15a and b depict
the equilibrium position against the applied electric field for different microparticle
sizes and densities, where the overlapping of equilibrium position in Fig. 8.15a
suggests that the critical electric value is almost independent of microparticle size.
Whereas the symmetry of the equilibrium position of microparticle with density
equal to 0.99 g · cm
−3 and 1.03 g · cm
−3 in Fig. 8.15b indicates that the slope of
the master curve of critical electric value is nearly independent of the magnitude of
equivalent microparticle density. To gain more insight into the dynamic behaviors
of the microparticle, the threshold value is plotted against
√
K /L in Fig. 8.15c and
d, where a Fréedericksz transition curve (black) is shown as well. The existence of
slightly difference instead of overlapping to each other for the equilibrium position
345
Fig. 8.14 Equilibrium position x 0 in response to electric field for different a cell thicknesses (8, 10,
12 and 15 µm), where the Frank elastic constant and the radius of microparticle are set as K = 7
pN and r = 2.5 µm, and bFrank elastic constants (8, 10, 12 and 15 pN), where the cell thickness
and the radius of microparticle are set as L = 10 µm and r = 2.5 µm. The electric field threshold
E c depends on c cell thickness L and d Frank elastic constant
√
K
L is and the larger the Frank elastic constant K is, the larger the critical electric
field is needed to trigger the positional transition. The further study of electric field
threshold (see Fig. 8.14c and d) shows that it seems to be inversely proportional to
cell thickness L and proportional to the root square of Frank elastic constant K , a
behavior similar to the field threshold of Fréedericksz phase transition.
In a similar way to the previous sections, the dependence of the threshold value
on microparticles size and density is also investigated. Figure 8.15a and b depict
the equilibrium position against the applied electric field for different microparticle
sizes and densities, where the overlapping of equilibrium position in Fig. 8.15a
suggests that the critical electric value is almost independent of microparticle size.
Whereas the symmetry of the equilibrium position of microparticle with density
equal to 0.99 g · cm
−3 and 1.03 g · cm
−3 in Fig. 8.15b indicates that the slope of
the master curve of critical electric value is nearly independent of the magnitude of
equivalent microparticle density. To gain more insight into the dynamic behaviors
of the microparticle, the threshold value is plotted against
√
K /L in Fig. 8.15c and
d, where a Fréedericksz transition curve (black) is shown as well. The existence of
slightly difference instead of overlapping to each other for the equilibrium position