

334
K. Xiao and C.-X. Wu
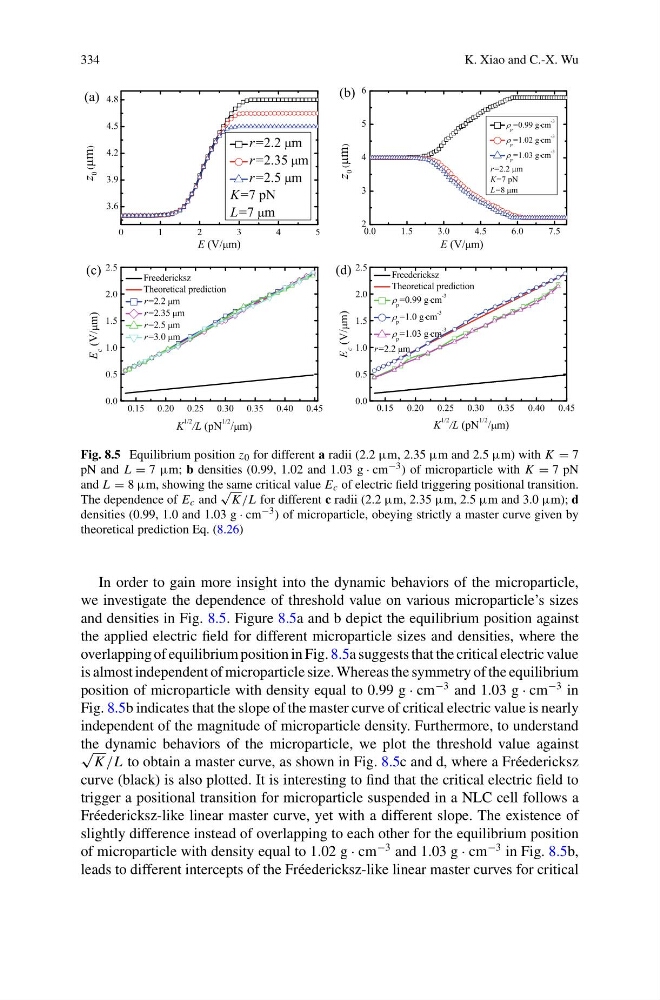
Fig. 8.5 Equilibrium position z 0 for different a radii (2.2 µm, 2.35 µm and 2.5 µm) with K = 7
pN and L = 7 µm; b densities (0.99, 1.02 and 1.03 g · cm −3 ) of microparticle with K = 7 pN
and L = 8 µm, showing the same critical value E c of electric field triggering positional transition.
The dependence of E c and
√
K /L for different c radii (2.2 µm, 2.35 µm, 2.5 µm and 3.0 µm); d
densities (0.99, 1.0 and 1.03 g · cm −3 ) of microparticle, obeying strictly a master curve given by
theoretical prediction Eq. (8.26)
In order to gain more insight into the dynamic behaviors of the microparticle,
we investigate the dependence of threshold value on various microparticle’s sizes
and densities in Fig. 8.5. Figure 8.5a and b depict the equilibrium position against
the applied electric field for different microparticle sizes and densities, where the
overlapping of equilibrium position in Fig. 8.5a suggests that the critical electric value
is almost independent of microparticle size. Whereas the symmetry of the equilibrium
position of microparticle with density equal to 0.99 g · cm
−3 and 1.03 g · cm
−3 in
Fig. 8.5b indicates that the slope of the master curve of critical electric value is nearly
independent of the magnitude of microparticle density. Furthermore, to understand
the dynamic behaviors of the microparticle, we plot the threshold value against
√
K /L to obtain a master curve, as shown in Fig. 8.5c and d, where a Fréedericksz
curve (black) is also plotted. It is interesting to find that the critical electric field to
trigger a positional transition for microparticle suspended in a NLC cell follows a
Fréedericksz-like linear master curve, yet with a different slope. The existence of
slightly difference instead of overlapping to each other for the equilibrium position
of microparticle with density equal to 1.02 g · cm
−3 and 1.03 g · cm
−3 in Fig. 8.5b,
leads to different intercepts of the Fréedericksz-like linear master curves for critical
K. Xiao and C.-X. Wu
Fig. 8.5 Equilibrium position z 0 for different a radii (2.2 µm, 2.35 µm and 2.5 µm) with K = 7
pN and L = 7 µm; b densities (0.99, 1.02 and 1.03 g · cm −3 ) of microparticle with K = 7 pN
and L = 8 µm, showing the same critical value E c of electric field triggering positional transition.
The dependence of E c and
√
K /L for different c radii (2.2 µm, 2.35 µm, 2.5 µm and 3.0 µm); d
densities (0.99, 1.0 and 1.03 g · cm −3 ) of microparticle, obeying strictly a master curve given by
theoretical prediction Eq. (8.26)
In order to gain more insight into the dynamic behaviors of the microparticle,
we investigate the dependence of threshold value on various microparticle’s sizes
and densities in Fig. 8.5. Figure 8.5a and b depict the equilibrium position against
the applied electric field for different microparticle sizes and densities, where the
overlapping of equilibrium position in Fig. 8.5a suggests that the critical electric value
is almost independent of microparticle size. Whereas the symmetry of the equilibrium
position of microparticle with density equal to 0.99 g · cm
−3 and 1.03 g · cm
−3 in
Fig. 8.5b indicates that the slope of the master curve of critical electric value is nearly
independent of the magnitude of microparticle density. Furthermore, to understand
the dynamic behaviors of the microparticle, we plot the threshold value against
√
K /L to obtain a master curve, as shown in Fig. 8.5c and d, where a Fréedericksz
curve (black) is also plotted. It is interesting to find that the critical electric field to
trigger a positional transition for microparticle suspended in a NLC cell follows a
Fréedericksz-like linear master curve, yet with a different slope. The existence of
slightly difference instead of overlapping to each other for the equilibrium position
of microparticle with density equal to 1.02 g · cm
−3 and 1.03 g · cm
−3 in Fig. 8.5b,
leads to different intercepts of the Fréedericksz-like linear master curves for critical