

276
6 Shocks and Surprises: Refining the Elementary Model
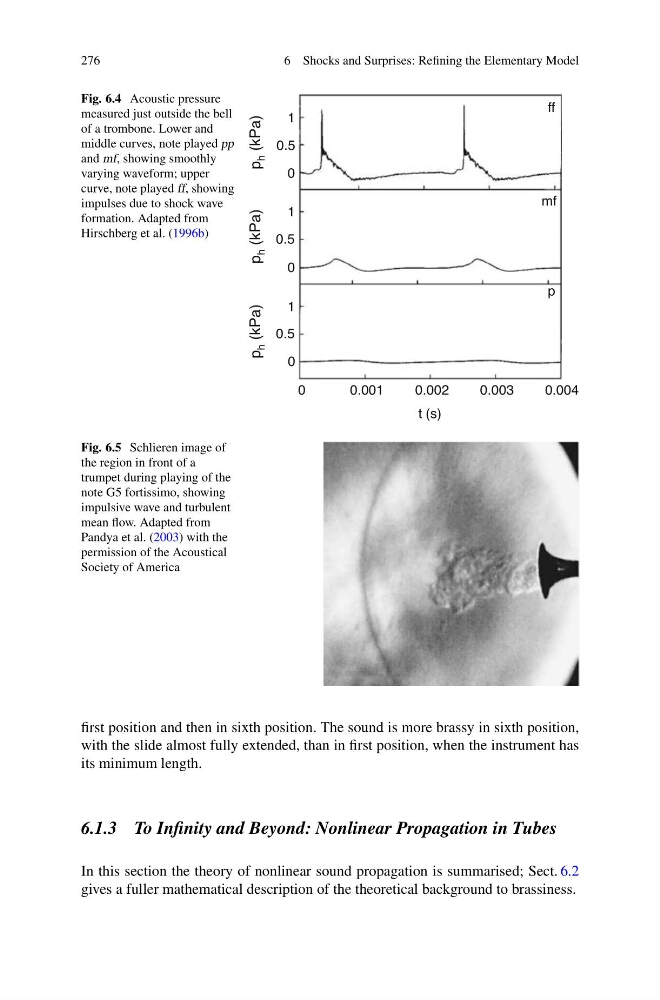
Fig. 6.4 Acoustic pressure
measured just outside the bell
of a trombone. Lower and
middle curves, note played pp
and mf, showing smoothly
varying waveform; upper
curve, note played ff, showing
impulses due to shock wave
formation. Adapted from
Hirschberg et al. (1996b)
p
h (kPa)
p
h (kPa)
p
h (kPa)
1
0.5
0
1
0.5
0
1
0.5
0
0
0.001
0.002
0.003
0.004
t (s)
ff
mf
p
Fig. 6.5 Schlieren image of
the region in front of a
trumpet during playing of the
note G5 fortissimo, showing
impulsive wave and turbulent
mean flow. Adapted from
Pandya et al. (2003) with the
permission of the Acoustical
Society of America
first position and then in sixth position. The sound is more brassy in sixth position,
with the slide almost fully extended, than in first position, when the instrument has
its minimum length.
6.1.3 To Infinity and Beyond: Nonlinear Propagation in Tubes
In this section the theory of nonlinear sound propagation is summarised; Sect. 6.2
gives a fuller mathematical description of the theoretical background to brassiness.
6 Shocks and Surprises: Refining the Elementary Model
Fig. 6.4 Acoustic pressure
measured just outside the bell
of a trombone. Lower and
middle curves, note played pp
and mf, showing smoothly
varying waveform; upper
curve, note played ff, showing
impulses due to shock wave
formation. Adapted from
Hirschberg et al. (1996b)
p
h (kPa)
p
h (kPa)
p
h (kPa)
1
0.5
0
1
0.5
0
1
0.5
0
0
0.001
0.002
0.003
0.004
t (s)
ff
mf
p
Fig. 6.5 Schlieren image of
the region in front of a
trumpet during playing of the
note G5 fortissimo, showing
impulsive wave and turbulent
mean flow. Adapted from
Pandya et al. (2003) with the
permission of the Acoustical
Society of America
first position and then in sixth position. The sound is more brassy in sixth position,
with the slide almost fully extended, than in first position, when the instrument has
its minimum length.
6.1.3 To Infinity and Beyond: Nonlinear Propagation in Tubes
In this section the theory of nonlinear sound propagation is summarised; Sect. 6.2
gives a fuller mathematical description of the theoretical background to brassiness.