

268
5 Blow That Horn: An Elementary Model of Brass Playing
acoustic modes, and the elementary model equations were solved in the time
domain using the MoReeSC software package (Silva et al. 2014). The lip resonance
frequency f l = 140 Hz and other parameters of the model were chosen so that
oscillation occurred at a frequency f buzz corresponding to the third natural note of
the trombone. In the simulation f buzz = 189 Hz, which is more than a semitone
higher than the third natural note played in the experimental phase of the study;
this discrepancy is a consequence of the simplified treatment of the lips as a 1DOF
outward-striking valve (Campbell 2004; Silva et al. 2007).
To avoid the necessity of modelling the behaviour of the larynx and the player’s
windway, the effect of the modulation of the air flow by the vibration of the vocal
folds was represented by adding an oscillating component to the mouth pressure:
p m (t) = p
0
m + p
1
m sin(2πf sing t),
(5.44)
where p 0
m is the constant mouth pressure assumed in the elementary model and p 1
m
is the amplitude of the pressure signal in the mouth during singing.
The simulated performance began with the lip oscillation, which was initiated by
raising the mouth pressure p 0
m to 4500 Pa, slightly above the threshold calculated
by linear stability analysis (Velut et al. 2017a). After an interval of 3 s to allow the
oscillating state to stabilise, the multiphonic was generated by adding the forcing
sinusoidal component to the static mouth pressure, at a frequency f sing = 1.5f buzz .
The amplitude of the forcing sinusoidal component was set to 30% of p 0
m .
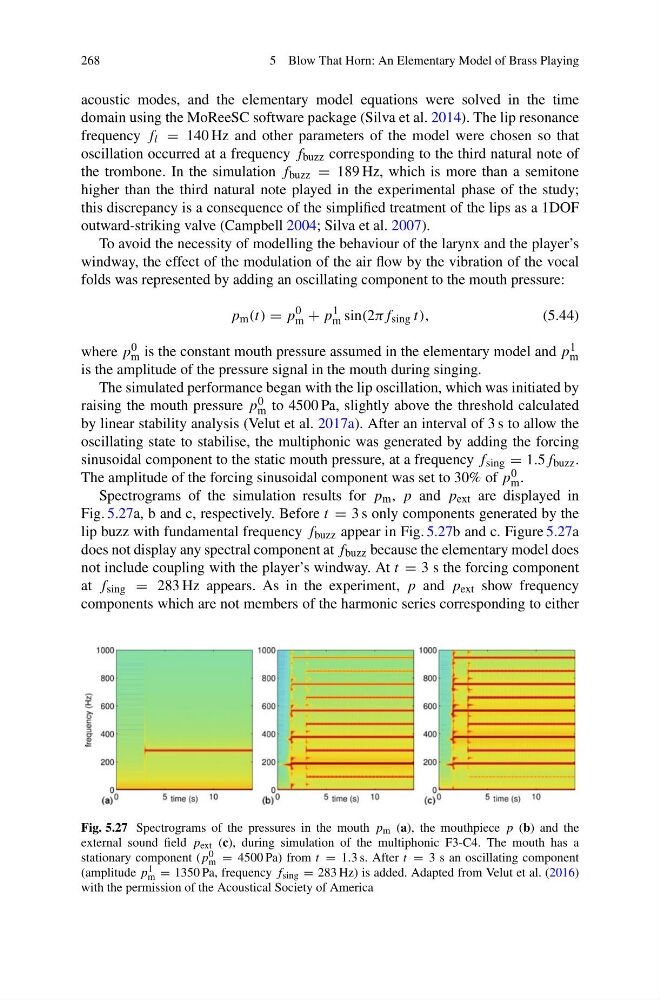
Spectrograms of the simulation results for p m , p and p ext are displayed in
Fig. 5.27a, b and c, respectively. Before t = 3 s only components generated by the
lip buzz with fundamental frequency f buzz appear in Fig. 5.27b and c. Figure 5.27a
does not display any spectral component at f buzz because the elementary model does
not include coupling with the player’s windway. At t = 3 s the forcing component
at f sing = 283 Hz appears. As in the experiment, p and p ext show frequency
components which are not members of the harmonic series corresponding to either
Fig. 5.27 Spectrograms of the pressures in the mouth p m (a), the mouthpiece p (b) and the
external sound field p ext (c), during simulation of the multiphonic F3-C4. The mouth has a
stationary component (p 0
m = 4500 Pa) from t = 1.3 s. After t = 3 s an oscillating component
(amplitude p 1
m = 1350 Pa, frequency f sing = 283 Hz) is added. Adapted from Velut et al. (2016)
with the permission of the Acoustical Society of America
5 Blow That Horn: An Elementary Model of Brass Playing
acoustic modes, and the elementary model equations were solved in the time
domain using the MoReeSC software package (Silva et al. 2014). The lip resonance
frequency f l = 140 Hz and other parameters of the model were chosen so that
oscillation occurred at a frequency f buzz corresponding to the third natural note of
the trombone. In the simulation f buzz = 189 Hz, which is more than a semitone
higher than the third natural note played in the experimental phase of the study;
this discrepancy is a consequence of the simplified treatment of the lips as a 1DOF
outward-striking valve (Campbell 2004; Silva et al. 2007).
To avoid the necessity of modelling the behaviour of the larynx and the player’s
windway, the effect of the modulation of the air flow by the vibration of the vocal
folds was represented by adding an oscillating component to the mouth pressure:
p m (t) = p
0
m + p
1
m sin(2πf sing t),
(5.44)
where p 0
m is the constant mouth pressure assumed in the elementary model and p 1
m
is the amplitude of the pressure signal in the mouth during singing.
The simulated performance began with the lip oscillation, which was initiated by
raising the mouth pressure p 0
m to 4500 Pa, slightly above the threshold calculated
by linear stability analysis (Velut et al. 2017a). After an interval of 3 s to allow the
oscillating state to stabilise, the multiphonic was generated by adding the forcing
sinusoidal component to the static mouth pressure, at a frequency f sing = 1.5f buzz .
The amplitude of the forcing sinusoidal component was set to 30% of p 0
m .
Spectrograms of the simulation results for p m , p and p ext are displayed in
Fig. 5.27a, b and c, respectively. Before t = 3 s only components generated by the
lip buzz with fundamental frequency f buzz appear in Fig. 5.27b and c. Figure 5.27a
does not display any spectral component at f buzz because the elementary model does
not include coupling with the player’s windway. At t = 3 s the forcing component
at f sing = 283 Hz appears. As in the experiment, p and p ext show frequency
components which are not members of the harmonic series corresponding to either
Fig. 5.27 Spectrograms of the pressures in the mouth p m (a), the mouthpiece p (b) and the
external sound field p ext (c), during simulation of the multiphonic F3-C4. The mouth has a
stationary component (p 0
m = 4500 Pa) from t = 1.3 s. After t = 3 s an oscillating component
(amplitude p 1
m = 1350 Pa, frequency f sing = 283 Hz) is added. Adapted from Velut et al. (2016)
with the permission of the Acoustical Society of America